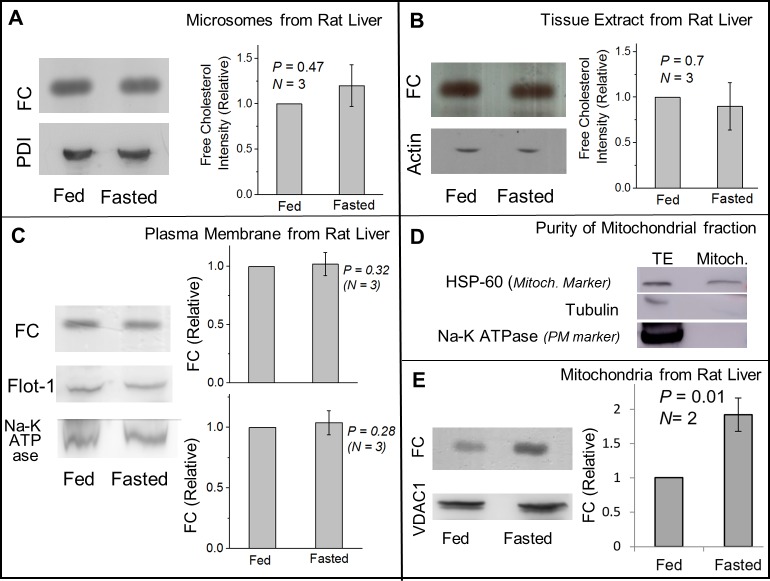
Fig 3. Comparison of free cholesterol levels between fed and fasted states on ER-enriched microsomes, liver tissue extract, plasma membrane and mitochondria.
(A) TLC showing equal FC levels in microsomes isolated from liver of fed and fasted rats. Equal loading was confirmed by western blotting for the ER marker PDI. Statistical analysis shows no significant change in FC levels in ER after fasting. Error bars are SEM. (B) TLC showing equal FC levels in total liver lysate prepared from fed and fasted rats. Western blotting for actin shows equal loading of liver lysate samples. Error bars are SEM. (C) TLC showing equal FC levels in PM-enriched membrane fractions isolated from liver of fed and fasted rats. Flotillin-1 also shows no change between these states. Western blotting for Na-K ATPase (PM marker) confirms equal loading of samples. There is no statistical difference in FC or Flot-1 levels on PM between fed and fasted liver. Error bars are SEM. (D) To determine the purity of mitochondria fraction, equal amount of protein of liver tissue extract (TE) and mitochondria (Mitoch.) were loaded in a gel for western blotting. The fraction was enriched in mitochondrial marker protein HSP60. Cytosolic (tubulin) and plasma membrane (Na-K ATPase) markers could not be detected in this fraction. (E) TLC on liver mitochondria samples shows higher FC levels in fasted as compared to fed state. Samples were normalised for equal protein, as confirmed by presence of VDAC1 (mitochondria marker). A statistically significant increase is observed in FC in fasted state as compared to fed state.

