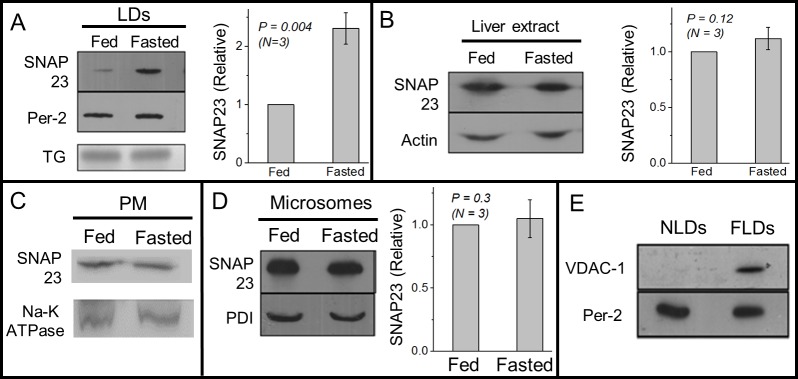
Fig 4. SNAP23 association with LDs, plasma membrane and microsomes across feeding-fasting transition.
(A) Western blotting against SNAP23 on NLD and FLD samples shows more SNAP23 on FLDs as compared to NLDs. Equal amount of NLDs and FLDs were used, as confirmed from equal intensity of perilipin-2 band by Western blotting and by TG band intensity in a TLC experiment. The experiment was repeated on three pairs of fed and fasted animals. Relative intensity of SNAP23 normalised to perilipin-2 levels has been used for statistical analysis. Error bars are SEM. (B) SNAP23 levels do not show significant change in liver extract prepared from fed and fasted rats. Actin was used as loading control. This observation was seen consistently in samples prepared from three pairs of animals. Error bars are SEM. (C) No significant change is observed in SNAP23 levels on PM-enriched fractions between fed and fasted states. Western blotting against Na-K ATPase (PM marker) was done to ensure equal loading of samples. (D) No significant change is observed in SNAP23 levels on microsome fractions between fed and fasted states. Western blotting against PDI shows equal loading of both the samples. Error bars are SEM. (E) Western blotting against VDAC-1 (mitochondria marker) on NLD and FLD samples. VDAC-1 is detected only on FLDs. This experiment was repeated on LD samples isolated from two pairs of fed and fasted animals.

