
Fig. 5.
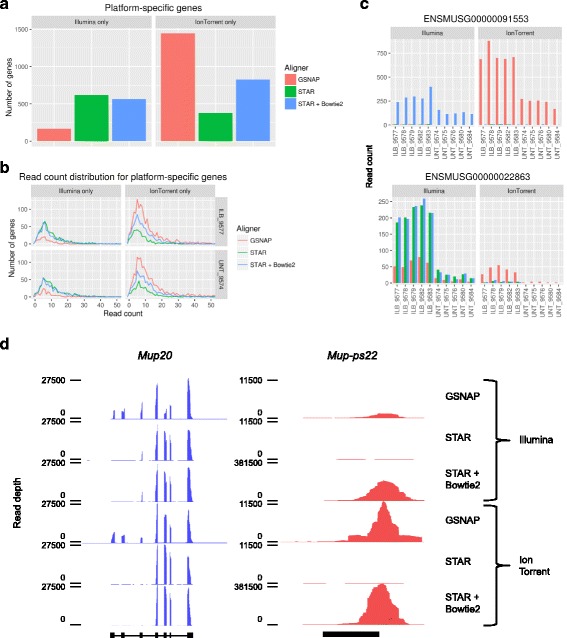
Differential gene detection due to platform/aligner choice. a Bar graphs displaying the number of genes detected exclusively by Illumina or Ion Torrent. These numbers are displayed for all three alignment algorithms. Detected genes are defined as those with at least 5 reads in 5 of the samples. b Distribution of read counts for platform-specific genes are displayed for two representative samples (IL-1β treated 9577 and untreated 9574), across all three alignment algorithms. The majority of platform-specific genes have less than 50 reads, so the graph’s x-axis is limited to the [0,50] range for display purposes. c Expression traces for two representative genes showing differential detection between platforms/aligners. Expression plots are colored according to aligner. d Coverage plots for a gene/pseudogene pair with significant differences across aligner/platform; Mup20 (left; blue) and Mup-ps22 (right; red) from a representative sample (untreated 9574) across all combinations of platform and aligner. Gene models for Mup20 and Mup-ps22 are displayed in the sense orientation (5′ → 3′) below the coverage plots. Note, the loci displayed for Mup20 and Mup-ps22 are 22,000 bp and 2000 bp in length, respectively