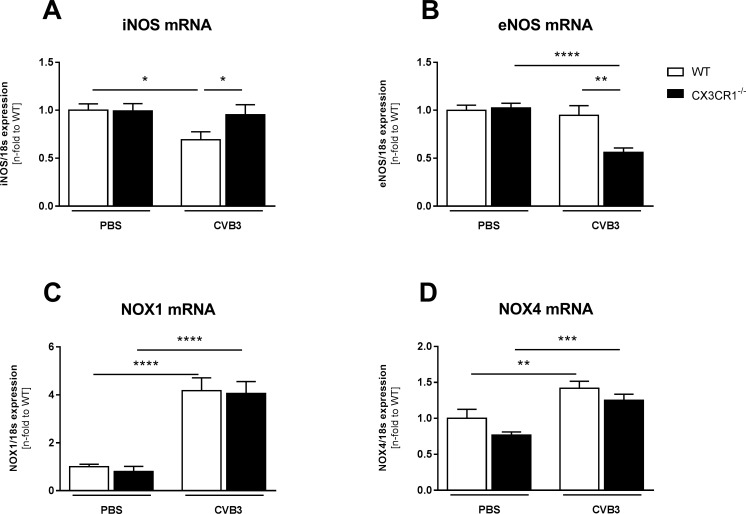
Fig 4. CX3CR1-/- displays increased left ventricular oxidative stress in Coxsackievirus B3-infected mice.
Bar graphs represent the mean ± SEM of gene expression data of LV (A) iNOS (B) eNOS, (C) NOX11, and (D) NOX4, as indicated, after normalization to the housekeeping gene 18S using the 2−ΔCt formula and normalized to the WT group, which was set as 1. (A,B) Gene expression analysis of NOS show differences between CX3CR1-/- CVB3 and WT CVB3 mice. Additional, no changes in NOX mRNA expression between CX3CR1-/- CVB3 and WT CVB3 mice could be observed (C,D). Statistical analysis was performed by One-way ANOVA or the Kruskal-Wallis test. *p<0.05, **p<0.01, ***p<0.001, ****p<0.0001 with n = 7–12 per group.

