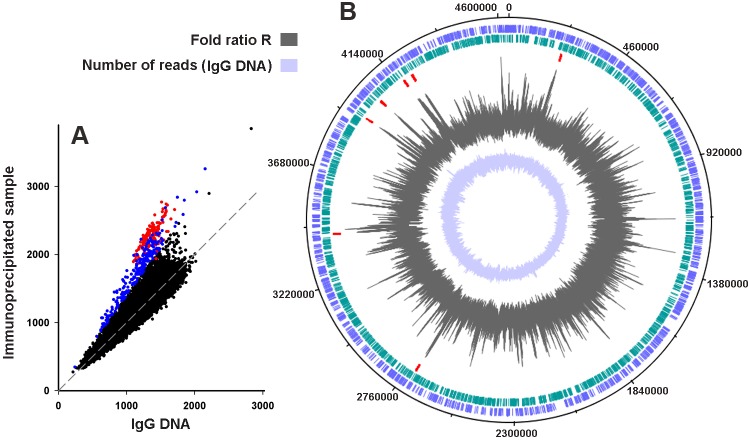
Fig 2. Dps binds genomic DNA in a non-random manner.
A: Correlation between the number of reads from immunoprecipitated and control sequence libraries calculated for 100 bp bins (first experiment). All points, corresponding to rRNAs operons are marked in red. All other points with R-values higher than 1.4 are plotted in blue. Dashed line shows the bisectrix of the plot. B: Distribution of the Dps-binding sites in the genome. Two outer circles represent the gene map of the top and the bottom strands of the E. coli MG1655 genome. The red ticks on the third circle mark positions of rRNA operons. The profile of R-values and the distribution of reads registered in the control library calculated for a 35 bp running window are plotted on the fourth and fifth circles, respectively.

