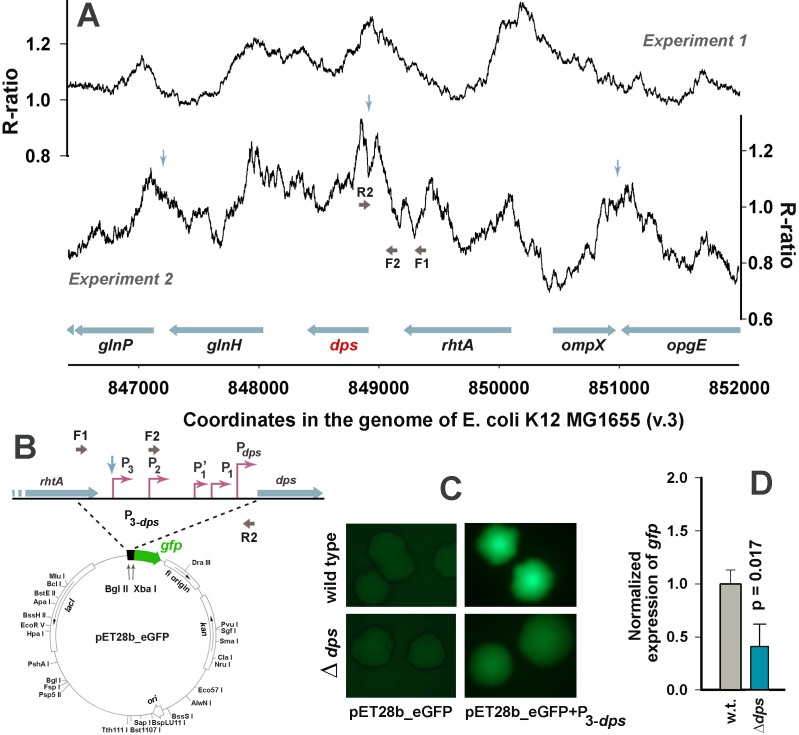
Fig 6. qRT-PCR and reporter assays revealed apparent positive autoregulation of the dps gene.
A: Profiles of the Dps binding sites obtained in two experiments for the dps genomic locus (running window of nine 35 bp bins). Genes are displayed as blue horizontal arrows. Vertical arrows show locations of inverted repeats, if longer than 7 bp (blue). Primer pair F1-R2 was used for cloning the whole regulatory region in pET28b_eGFP. The dps_short fragment (positive control in all band-shift assays) was amplified with F2-R2. B: Scheme of the pET28b-eGFP reporter vector with the insert of the dps promoter region. C: Images of E. coli MG1655 cell colonies transformed by pET28b-eGFP plasmid with or without the promoter insert. Images were obtained by fluorescent microscope Leica with 2 or 0.5 sec exposition for control and experimental cells, respectively. D: Changes in the expression efficiency of gfp in response to dps deletion measured in qRT-PCR using kan as a reference gene. Expression levels were estimated based on 3 biological samples with 3 technical repeats in each. Error bars show an average deviation. Statistical significance was assessed using Student’s t-test.

