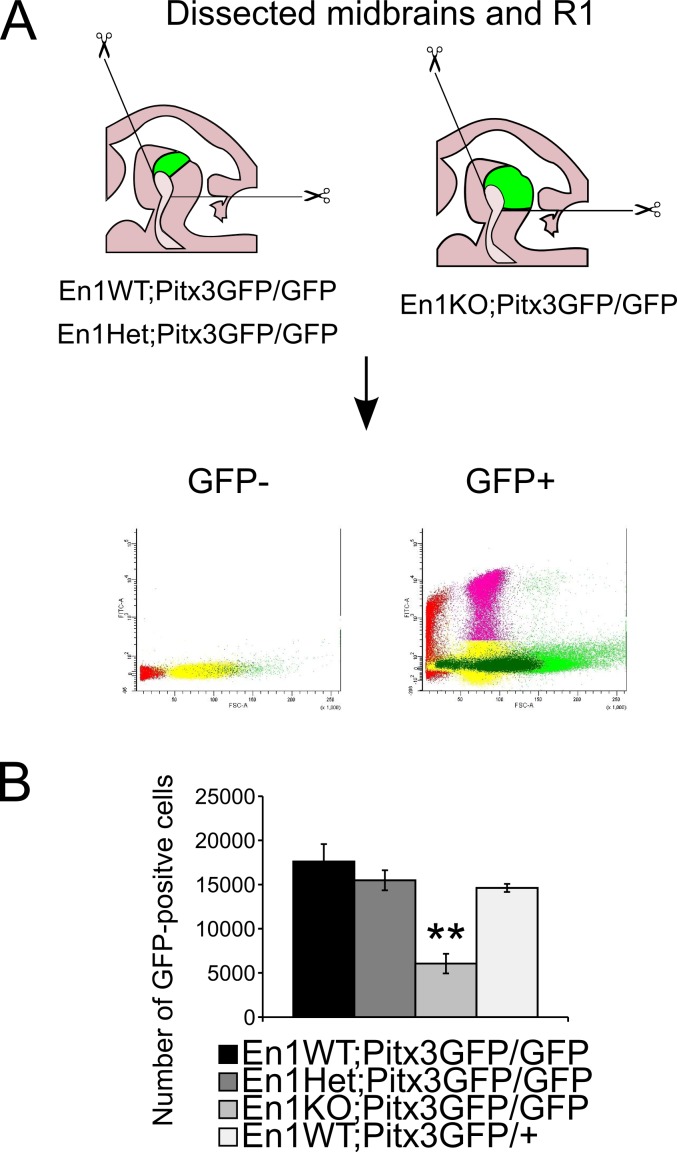
Fig 3. Quantification of the number of GFP-positive neurons present in the midbrains of multiple En1-/Pitx3-mutants at E14.5.
(A) Schematic representation of the isolation of midbrain and R1, and subsequent FAC-sorting setup at E14.5 to be used for quantification of number of GFP-positive neurons. (B) At E14.5, ~15000 GFP-positive mdDA neurons were sorted from control, En1WT;Pitx3GFP/GFP and En1Het;Pitx3GFP/GFP animals. In contrast, only ~5000 GFP-positive mdDA neurons were present in the En1KO;Pitx3GFP/GFP midbrain/R1 (** = P<0.01, n = 3/4).

