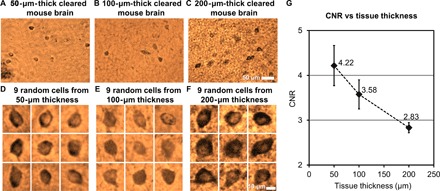
Fig. 2. Imaging comparison of different thicknesses of cleared tissue.

(A to C) Sub-FOVs of the pseudocolored lens-free reconstructed images of a 50-, 100-, and 200-μm-thick cleared mouse brain tissue. Each one of these images was digitally focused to a few arbitrary cells located within the sample. The 50-μm-thick sample is the same sample shown in fig. S1. (D to F) Nine randomly selected cells from each sample thickness are illustrated. (G) Mean CNR of the reconstructed neurons within the cleared tissue as a function of its thickness. Error bars represent the SEM, which is equal to the SD divided by the square root of the number of sampled cells.
