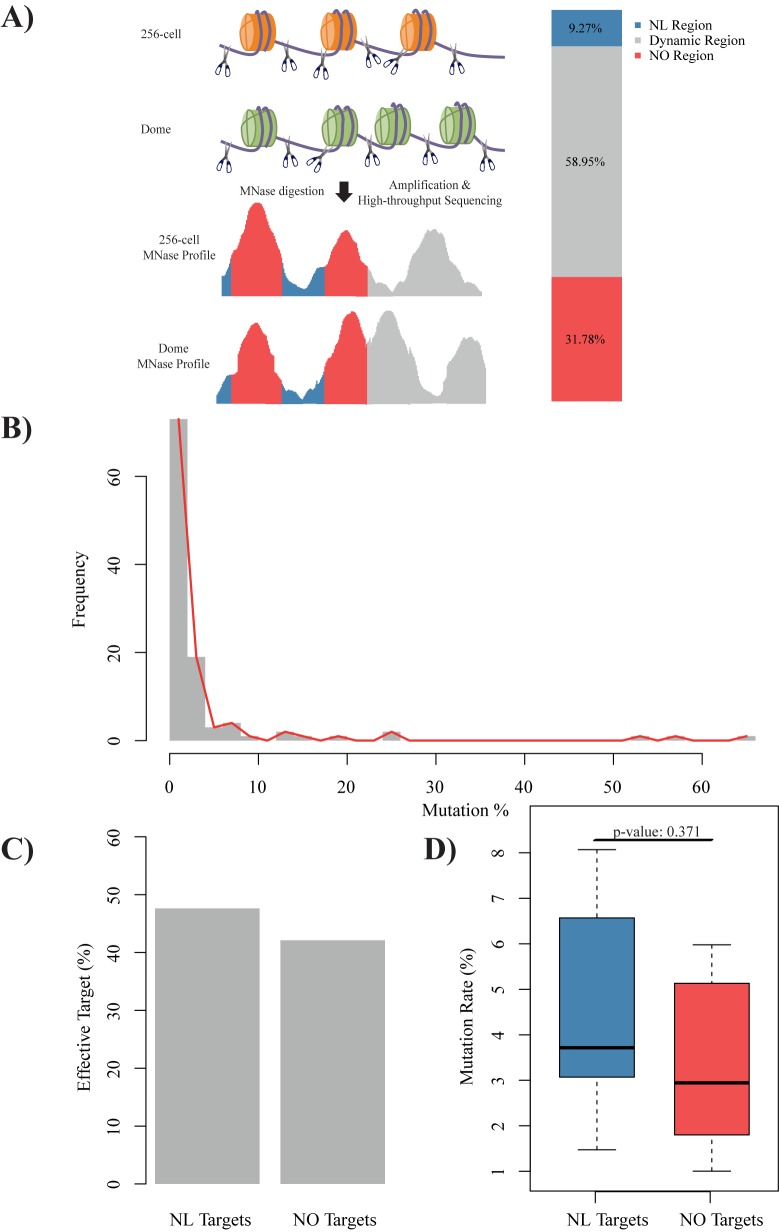
Fig 2. CRISPR/Cas9 efficiency did not show clear correlation with nucleosome organization.
(A) Schematic diagram of nucleosome organization status identification according to our previous MNase-seq data (GSE44269, see Material and Method section for details). Zebrafish genebody (Refseq annotation) was divided into nucleosome linker (NL, blue) region, nucleosome organization (NO, red) region, and dynamic nucleosome region (grey). (B) Distribution of mutation rate. (C) Barplot of proportion of effective gRNA targeting on NL region (left) and NO region (right), odds ratio: 1.22. (D) Boxplot of mutation rate of gRNA targeting on NL region (blue) and NO region (red), t-test p-value: 0.371.

