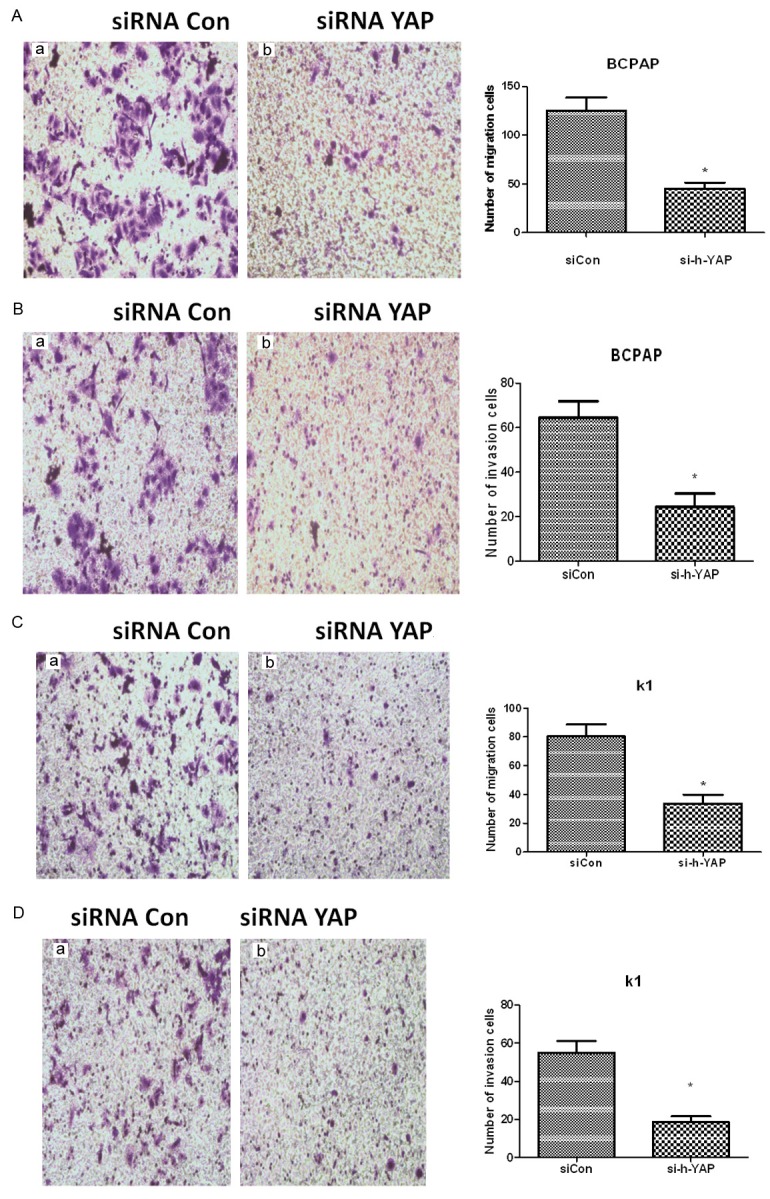
Figure 4.

A. YAP knockout inhibits migration of BCPAP cells. BCPAP cells were treated with siRNA Con or siRNA YAP and cell migration assessed. The right hand graph is a quantification of BCPAP migration (*represents P<0.05 compared with siRNA Con, n=3 independent experiments). B. YAP knockout inhibits invasion of BCPAP cells. BCPAP cells were treated with siRNA Con or siRNA YAP and cell invasion ability assessed. The right hand graph is a quantification of BCPAP invasion (*represents P<0.05 compared with siRNA Con, n=3 independent experiments). C. YAP knockout inhibits migration of KI cells. KI cells were treated with siRNA Con or siRNA YAP and cell migration assessed. The right hand graph is a quantification of KI migration (*represents P<0.05 compared with siRNA Con, n=3 independent experiments). D. YAP knockout inhibits invasion of KI cells. KI cells were treated with siRNA Con or siRNA YAP and cell invasion ability assessed. The right hand graph is a quantification of KI invasion (*represents P<0.05 compared with siRNA Con, n=3 independent experiments).
