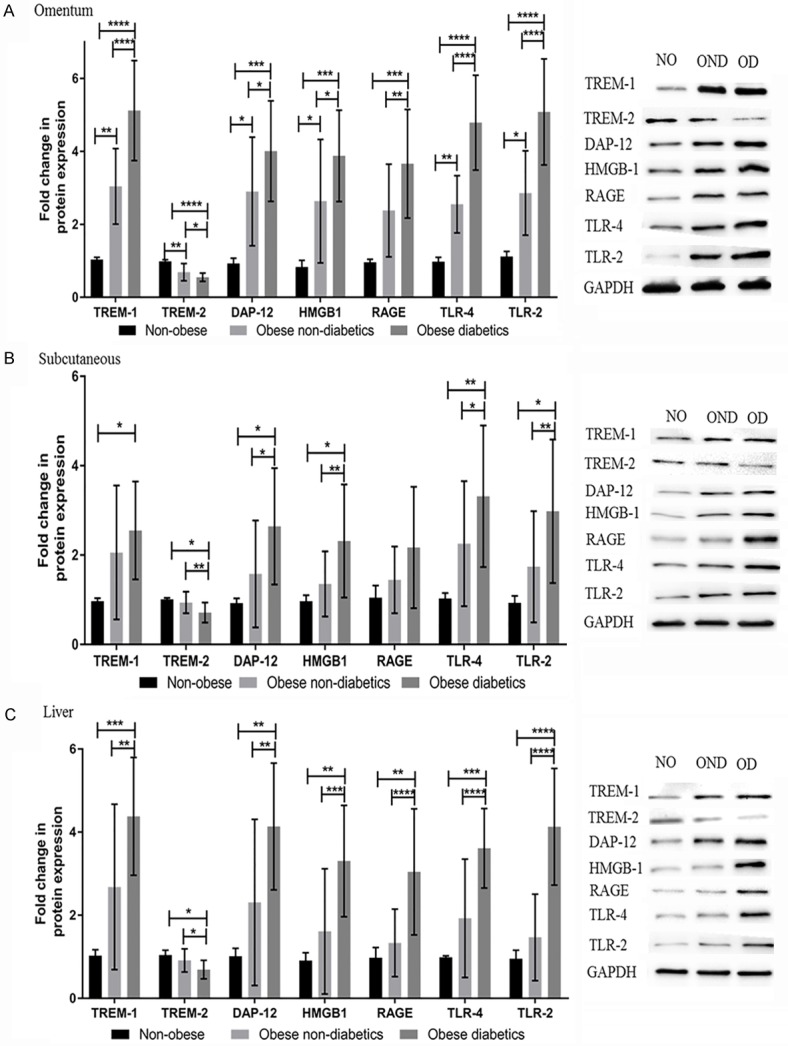
Figure 2.

TREM-1, TREM-2, DAP12, HMGB1, RAGE, TLR-4 and TLR-2 protein expression studies using western blotting in the biopsy samples of study subjects. A: Gene Expression study in omentum biopsy samples. B: Gene Expression study in subcutaneous biopsy samples. C: Gene Expression study in liver biopsy samples. The band intensity was measured by densitometry analysis using Image J software. Results were expressed as fold change (relative to GAPDH) in obese non-diabetics and obese diabetics compared to non-obese subjects. The protein expression of these target genes levels in biopsy samples were compared between non-obese, obese non-diabetics and obese diabetics using One-way ANOVA for continuous variables. Data were shown as mean ± SD (N=5 non-obese (NO); 24 obese non-diabetics (OND); 22 obese diabetics (OD); *P<0.05, **P<0.01, ***P<0.001, and ****P<0.0001.
