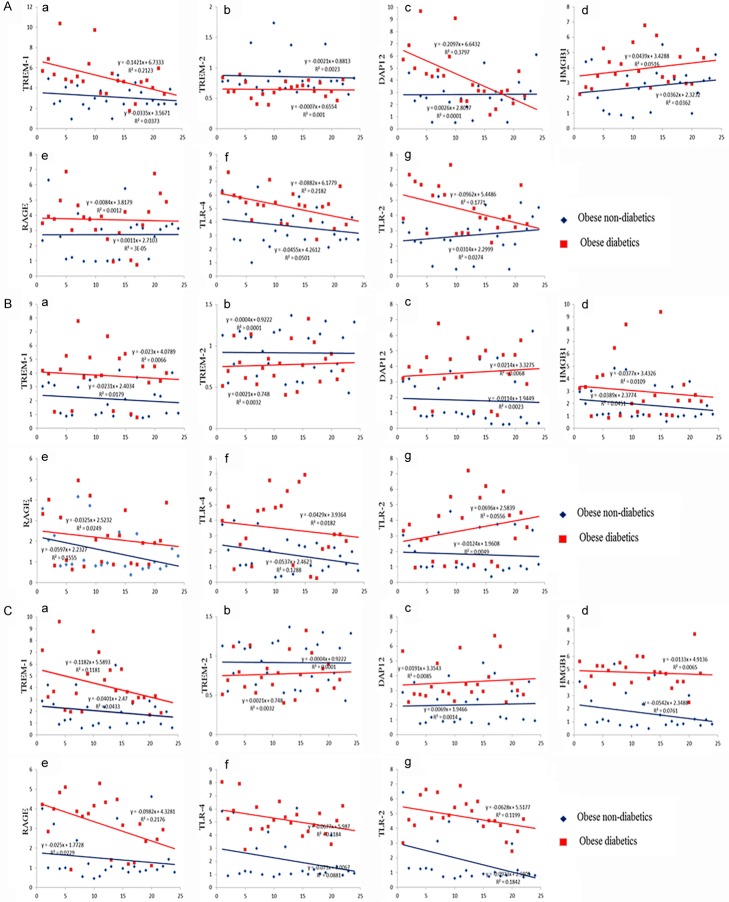
Figure 5.
Correlation of TREM-1, TREM-2, DAP12, HMGB1, RAGE, TLR-4 and TLR-2 expression using scatter blot between obese non-diabetics and obese diabetics. A: Correlation analysis in omentum biopsy samples. B: Correlation analysis in subcutaneous biopsy samples. C: Correlation analysis in liver biopsy samples. Number (n) of patients is given in Y axis (24 obese non-diabetics; 22 obese diabetics). Increased TREM-1, DAP-12, HMGB-1, RAGE, TLR4 and TLR2 in the biopsy tissues was positively associated with obese diabetics compared to obese non-diabetics. Blue linear trend line indicates the expression levels in obese non-diabetics; Red linear trend line indicates the expression levels in obese diabetics.

