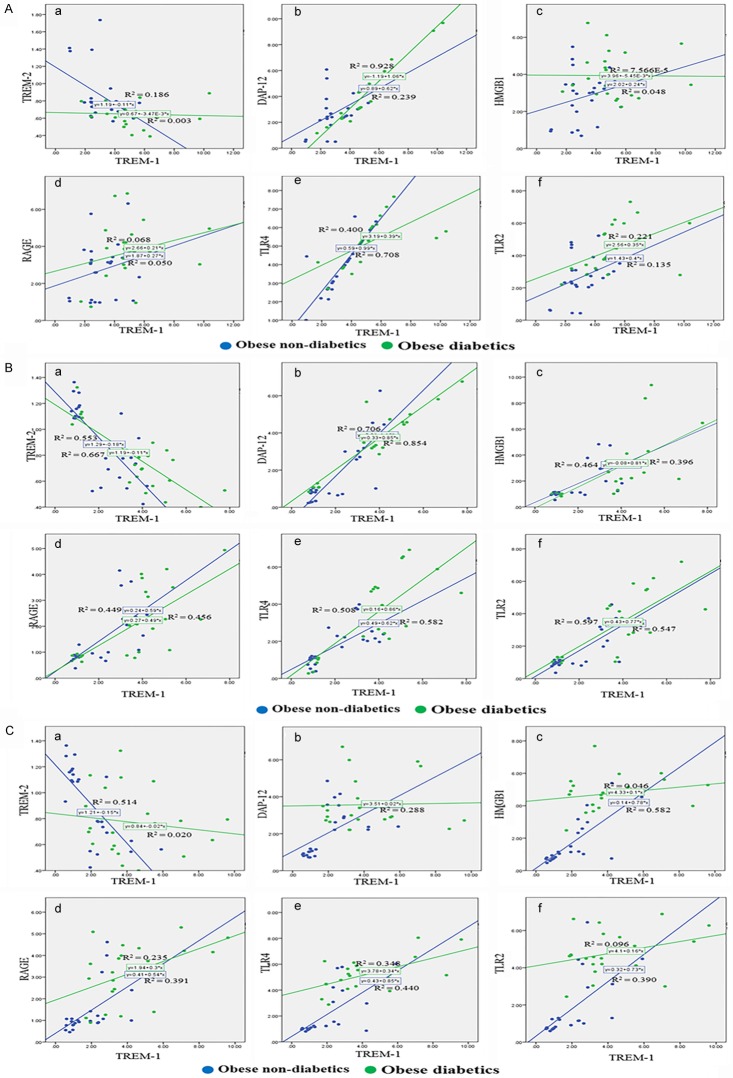
Figure 6.
Graphical representation of the analysis of TREM-1 in association with TREM-2, DAP12, HMGB1, RAGE, TLR-4 and TLR-2 using scatter blot between obese non-diabetics and obese diabetics. A: Correlation analysis in omentum biopsy samples. B: Correlation analysis in subcutaneous biopsy samples. C: Correlation analysis in liver biopsy samples. Analysis showed strong association of the increased TREM-1 with DAP12, HMGB1, RAGE, TLR-4 and TLR-2 in obese diabetics. Blue linear trend line indicates the expression levels in obese non-diabetics; Green linear trend line indicates the expression levels in obese diabetics.

