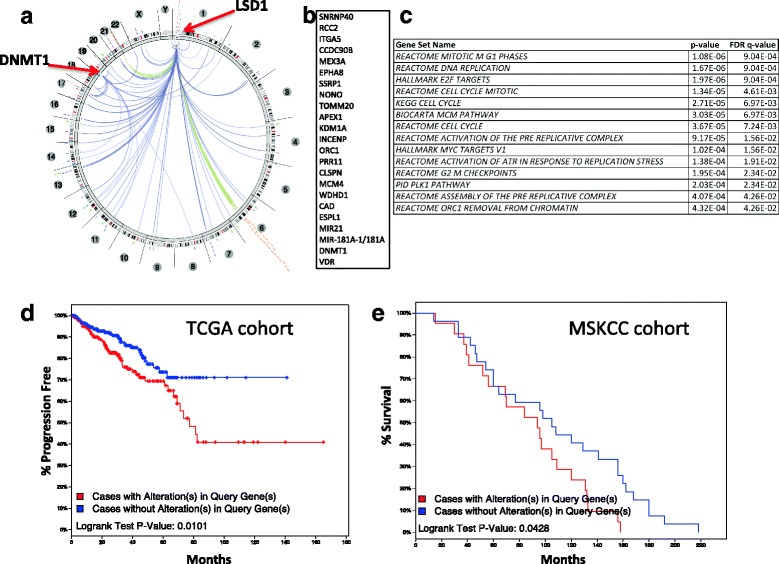
Fig. 6.

Graphical overview of the alterations in the LSD1/DNMT1/VDR signature. The Regulome Explorer was used to identify genes correlating with LSD1/DNMT1 status, followed by functional enrichment analysis and survival analysis on two independent TCGA datasets. a Circos plot showing the genes correlating with LSD1 and DNMT1 status. b List of the genes in the LSD1/DNMT1/VDR signature. c Functional enrichment analysis of the genes in the LSD1/DNMT1/VDR signature indicating pathway name and origin, p value, and FDR-corrected q value. d, e Kaplan-Meier plot indicating progression-free survival in patients with primary tumor (d) or overall survival in patients with recurrent metastatic tumor (e). The red lines indicate patients with altered LSD1/DNMT1/VDR signature (z score > ± 2), and the blue lines indicate patients whose signature is not altered (z score between − 2 and + 2). Statistical significance was calculated via log-rank test with a threshold of p < 0.05
