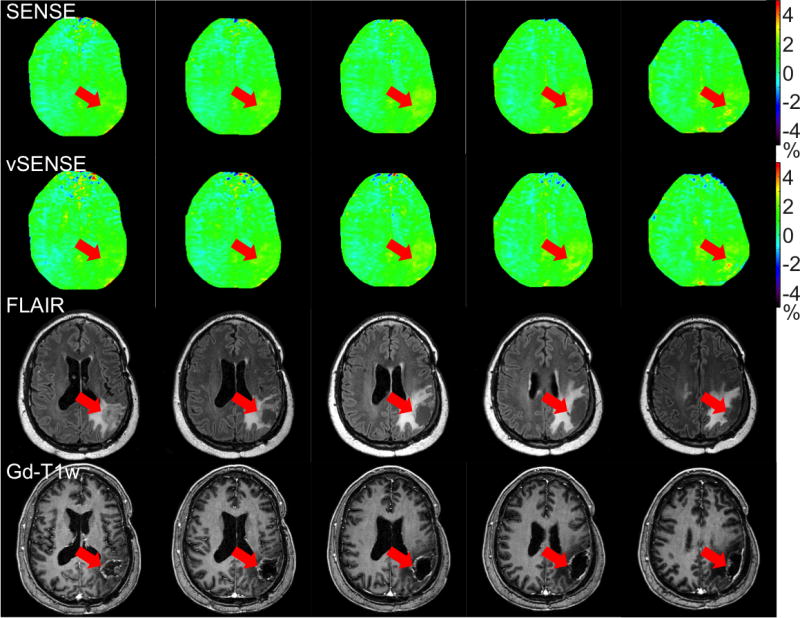
Figure 4.

Five out of a total of fifteen APTw images from a post-treatment brain tumor patient using SENSE and vSENSE in conjunction with corresponding anatomical FLAIR and post-gadolinium T1w (Gd-T1w) images. SENSE used an R factor of 2 for all frames. vSENSE used proactive R factors of 4 for the S0, ±3ppm and ±4ppm frames, and of 2 for the ±3.5ppm frames. The mean R factor for all frames was 3.1 for vSENSE. No substantial enhancement was seen on APTw images, agreeing with the clinical diagnosis of treatment effects instead of active tumors.
