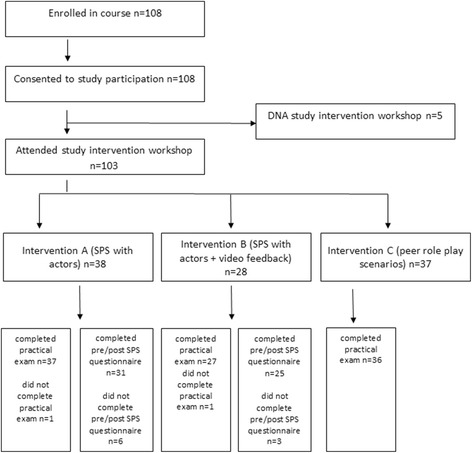
Fig. 1.

Shows the participation flow through study interventions and completion of outcome measures. Legend DNA = did not attend; SPS = standardised patient scenario

Shows the participation flow through study interventions and completion of outcome measures. Legend DNA = did not attend; SPS = standardised patient scenario