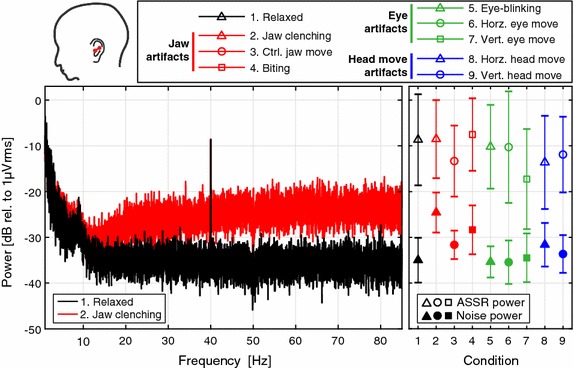
Fig. 4.

Grand average power spectra for the ELE ear electrode. Left grand average power spectra for the relaxed and jaw clenching condition from the ELE–ELB electrode pair, as indicated by the red line sketched on the head drawing in the top. Right the markers indicate the grand average ASSR power and mean noise power from 32 to 48 Hz. The error bars denote ±1 standard deviation, calculated as the grand standard deviation of the ASSR or noise power in dB
