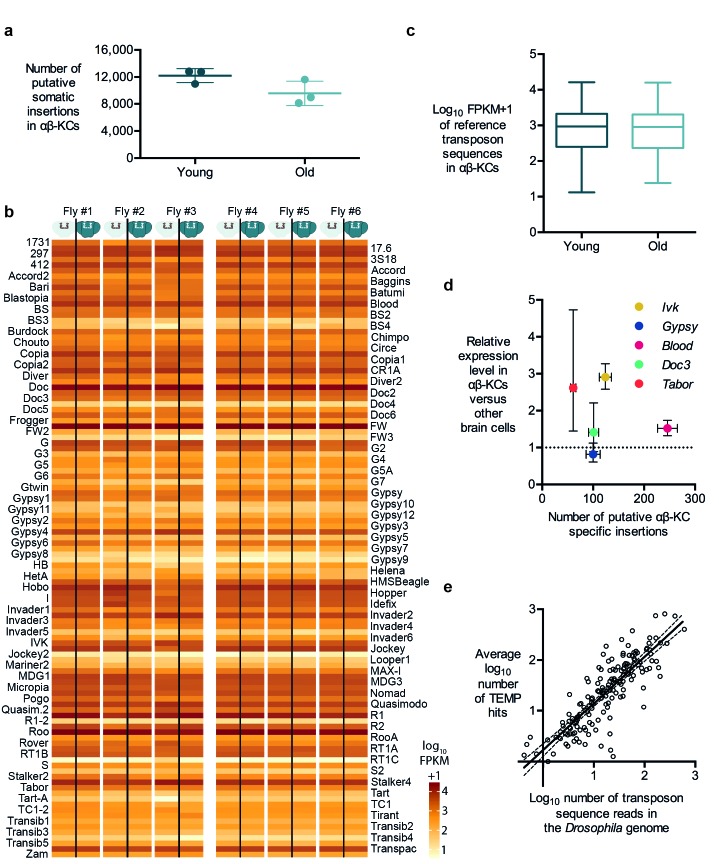
Figure 3. Transposon copy number and putative insertion rates do not correlate with age or transposon expression levels.
(a) The number of putative somatic insertion events does not differ between young (3–4 days) and old (30 days) flies (Mann-Whitney test, p=0.2). Error bars denote SEM. (b) Heatmap showing the normalized number of sequencing reads that map onto each of the 111 reference transposon sequences that were analyzed in this study. None of the few visible differences in the amount of transposon sequences in the gDNA from αβ-KCs when compared to the rest of the brain of the same individual are statistically significant. Individuals #1 - #3 are young flies (3–4 days) and #4 - #6 are old flies (30 days). FPKM stands for fragments per kilobase of transposon sequence per million fragments mapped. (c) Boxplot showing the normalized number of reads that map onto each of the 111 reference transposon sequences per αβ-KC sample of young (3–4 days) and old (30 days) flies. Whiskers represent Min and Max and the box represents the first and third interquartile interval. No statistical difference was evident (Mann-Whitney test, p=0.9184). (d) Plot showing no linear correlation between the expression levels of 5 different transposons in αβ-KCs and the number of putative new insertions of each transposon identified in these cells. gDNA data was acquired from 6 independent biological replicates. Error bars denote SEM. (e) Plot showing the logarithmic number of reads that map to each transposon consensus sequence taken from the Drosophila genome on the x-axis, and the logarithmic average number of putative insertions in 6 flies. Each point represents one transposon type. The line depicts the linear regression (R2 = 0.7166) and the 95% confidence interval.

