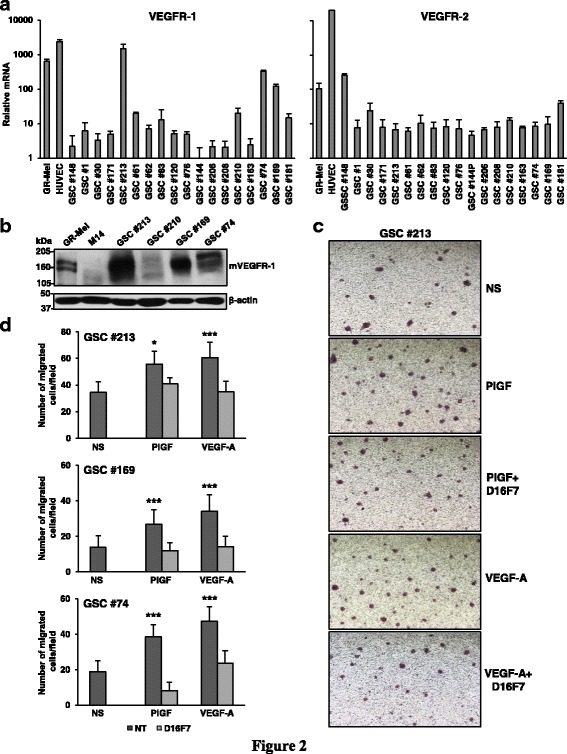
Fig. 2.

D16F7 inhibitory effects on VEGF-A or PlGF-induced migration of GSCs. a Detection of VEGFR-1 and VEGFR-2 transcripts in GSC lines was performed by qRT-PCR. Results indicate relative mRNA expression and are the mean ± SD of three independent determinations. b VEGFR-1 protein levels were analyzed by Western blotting using β-actin detection as loading control. HUVEC and M14 cells were used as positive and negative controls, respectively. c Migration of GSCs in response to PlGF or VEGF-A in the absence or in the presence of 5 μg/ml D16F7 was analyzed as described in Fig. 1c legend. Photographs from a representative experiment out of three with #213 cells are shown (40× magnification). d Histograms represent the mean ± SD (n = 3) of migrated cells/microscopic field. Results of statistical analysis using one-way ANOVA, followed by Bonferroni’s post-test were as follows: in #213, PlGF vs NS or PlGF vs PlGF + D16F7, p < 0.05 (*); VEGF-A vs NS or VEGF-A vs VEGF-A + D16F7, p < 0.001 (***); for #169, PlGF vs NS or PlGF vs PlGF + D16F7 and VEGF-A vs NS or VEGF-A vs VEGF-A + D16F7, p < 0.001 (***); in #74, PlGF vs NS or PlGF vs PlGF + D16F7 and VEGF-A vs NS or VEGF-A vs VEGF-A + D16F7, p < 0.001 (***). Differences between NS and PlGF + D16F7 or VEGF-A + D16F7 were not statistically significant
