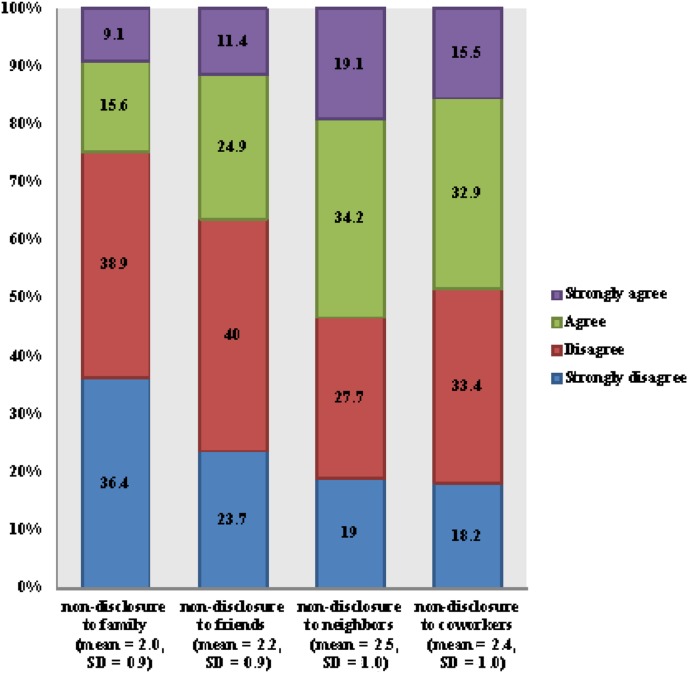
Figure 1.
Willingness to disclose a cancer diagnosis (n = 953). Categories higher in each bar graph represent lower willingness to disclose cancer diagnosis. For calculation of means, values were assigned to categories as follows: strongly disagree = 1, disagree = 2, agree = 3, strongly agree = 4. Higher means thus corresponds to higher stigma.
Abbreviation: SD, standard deviation.

