
Fig. 3.
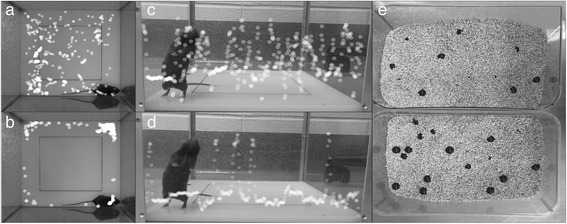
Comparison of Normal Mouse (top row) vs. Impaired One (bottom row). The white dots are the position of mouse neck (junction of head and body) at each second during first 10 mins of open-field activity test (superimposed scatter plots are generated using idTracker [62]). The impaired mouse spends more time at periphery (a vs. b) and did less rearing (c vs. d) and buried fewer marbles after 30 min test (e top vs. bottom)