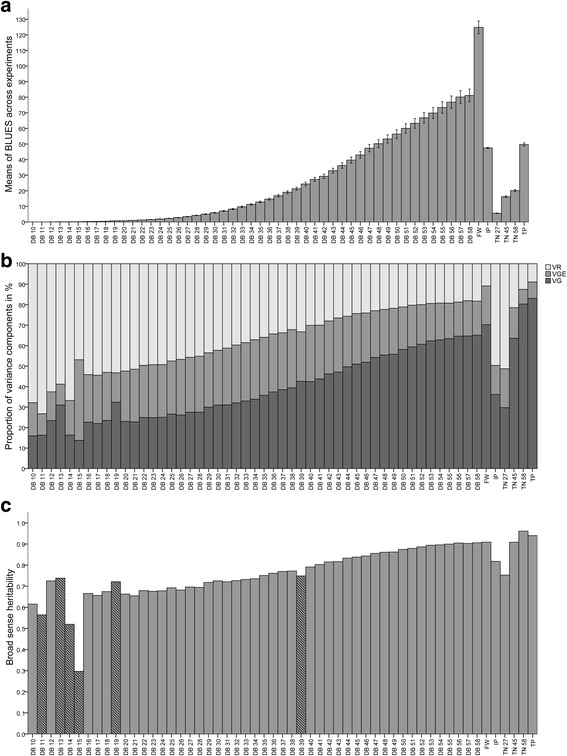
Fig. 1.

Overview of BLUEs, variance components, and broad sense heritability of estimated traits for 100 barley lines. a Bar diagram of the overall BLUEs for all analyzed traits: digital biomass (DB) from 10 to 58 days after sowing (DAS) in 106 Voxel, fresh weight (FW) in g estimated at DAS 59, inflection point (IP) in DAS, tiller number (TN) at DAS 27, 45 and 58 and tipping time (TP). Error bars represent the 95% confidence interval. b Proportion of variance components in % for each time point of DB (DB10 to DB58), FW, IP, TN (TN 27, 45 and 58) and TP, where VG refers to genotypic variance, VGE to genotype x environment interaction and VR the variance of the rest (unexplained variance). c Bar diagram presenting broad sense heritability values for DB (DB10 to DB58), FW, IP, TN (TN 27, 45 and 58) and TP. Hatched bars represent days with missing data
