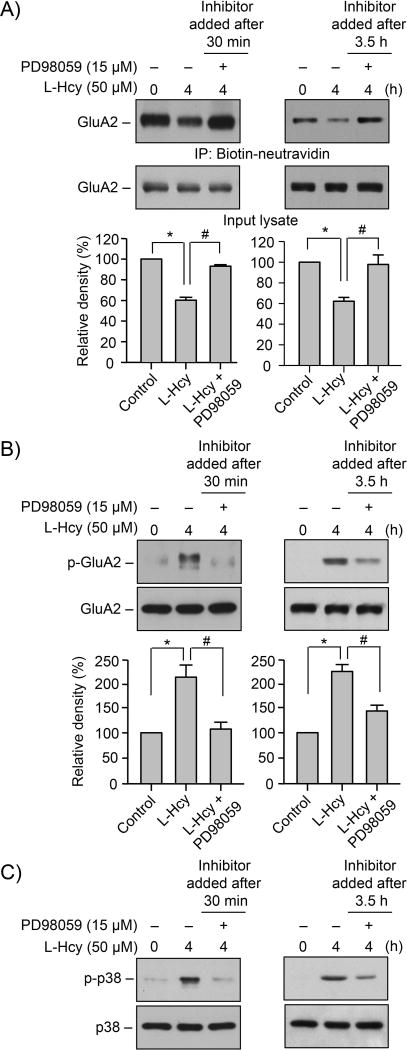
FIGURE 6. Homocysteine-NMDAR induced alteration in GluA2-AMPAR surface expression is regulated by ERK MAPK.
(A–C) Neuron cultures were exposed to 50 μM of L-homocysteine (L-Hcy) for 4 h and PD98059 was added either 30 min or 3.5 h after the onset of L-Hcy treatment. (A) Biotinylated surface proteins were processed for immunoblot analysis with anti-GluA2 antibody (upper panel). The total GluA2 in the input lysates was also analyzed using anti-GluA2 antibody (lower panel). (B, C) Equal amount of protein from total cell extracts was analyzed by immunoblotting using (B) anti-p-GluA2 or (C) anti-p-p38 antibody (upper panels). The blots were re-probed with (B) anti-GluA2 or (C) anti-p38 antibody (lower panels). (A, B) Quantitative analysis of GluA2 surface expression and phosphorylation at Ser880 is represented as mean ± SEM (n = 4). *p < 0.05 from 0 min time point or control; #p < 0.05 from 4 h homocysteine treatment.

