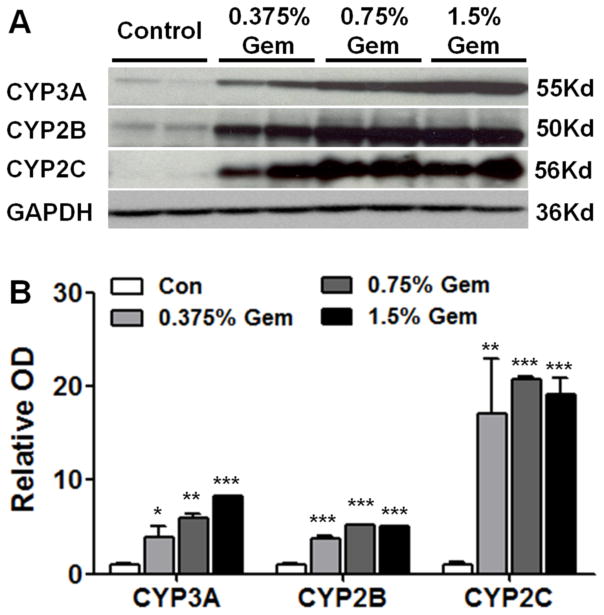
Fig. 2.
Western-blot analysis of CYPs. (A) Protein levels of CYP3A, CYP2B and CYP2C. (B) Densitometry analysis of western-blot results. Specific band intensity was quantified, normalized to GAPDH. Data were from liver samples collected 14 days after gemfibrozil diet treatment and two were randomly selected for protein analysis. GAPDH was used as a loading control. Data are expressed as mean ± SD (Gem: gemfibrozil, n=5, *P<0.05, **P<0.01, ***P<0.001).

