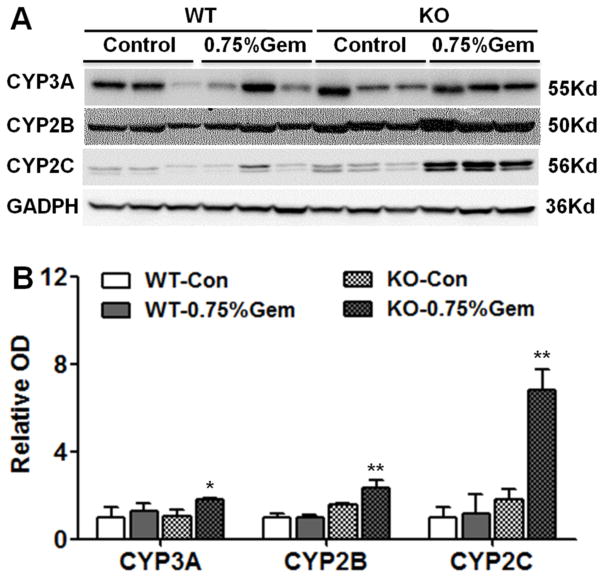
Fig. 5.
Western blot and densitometry analysis of CYPs in wild-type and Pparα-null mouse liver extracts. Liver samples were collected 14 days after 0.75% gemfibrozil-containing diet treatment. GAPDH was used as a loading control. The molecular weight was indicated at the right side of the respective band. (A) Western blot of CYP3A, CYP2B, and CYP2C in both mouse lines. (B) Densitometry analysis of CYP3A, CYP2B, CYP2C in liver extracts. Results of the control group were set as 1 and the data expressed as relative intensity respectively. Data are expressed as mean ± SD (WT: wild-type; KO: Pparα-null; Gem: gemfibrozil, n=3, *P<0.05, **P<0.01).

