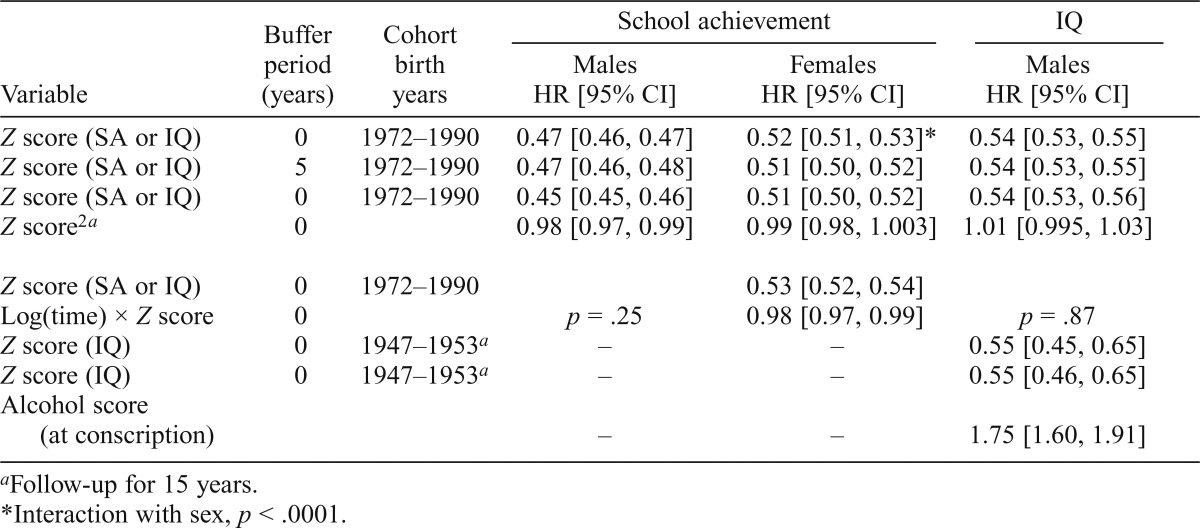
Table 2.
Hazard ratios (HRs) and 95% confidence intervals (CIs) for association between school achievement (SA) and IQ (standardized as Z scores) and risk of alcohol use disorder (AUD)
| Variable | Buffer Period (years) | Cohort Birth years | School achievement |
IQ |
|
| Males HR [95% CI] | Females HR [95% CI] | Males HR [95% CI] | |||
| Z score (SA or IQ) | 0 | 1972–1990 | 0.47 [0.46, 0.47] | 0.52 [0.51, 0.53]* | 0.54 [0.53, 0.55] |
| Z score (SA or IQ) | 5 | 1972–1990 | 0.47 [0.46, 0.48] | 0.51 [0.50, 0.52] | 0.54 [0.53, 0.55] |
| Z score (SA or IQ) | 0 | 1972–1990 | 0.45 [0.45, 0.46] | 0.51 [0.50, 0.52] | 0.54 [0.53, 0.56] |
| Z score2a | 0 | 0.98 [0.97, 0.99] | 0.99 [0.98, 1.003] | 1.01 [0.995, 1.03] | |
| Z score (SA or IQ) | 0 | 1972–1990 | 0.53 [0.52, 0.54] | ||
| Log(time) × Z score | 0 | p = .25 | 0.98 [0.97, 0.99] | p = .87 | |
| Z score (IQ) | 0 | 1947–1953a | – | – | 0.55 [0.45, 0.65] |
| Z score (IQ) Alcohol score | 0 | 1947–1953a | – | – | 0.55 [0.46, 0.65] |
| (at conscription) | – | – | 1.75 [1.60, 1.91] | ||
Follow-up for 15 years.
Interaction with sex, p < .0001.

