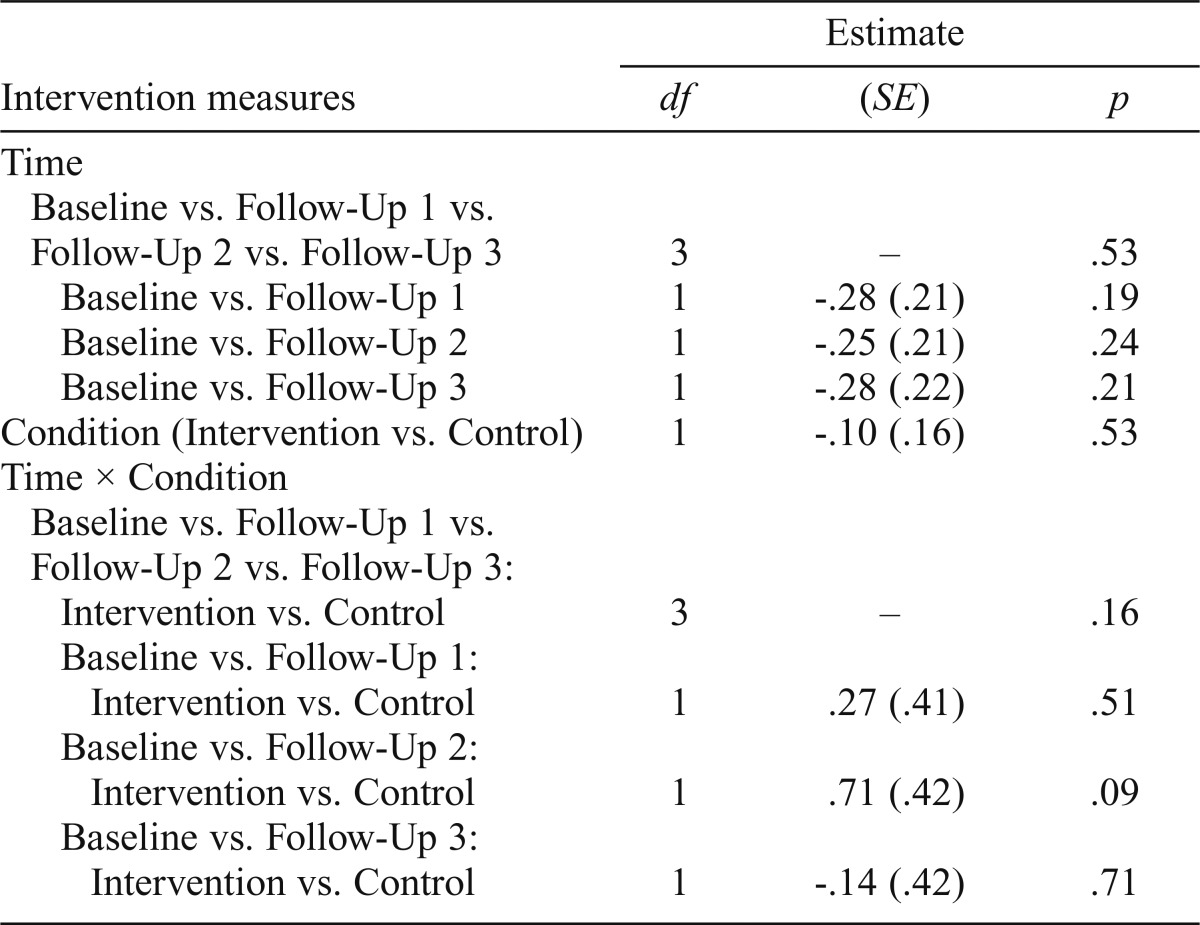
Table 1.
Intention to treat results: unadjusted models
| Intervention measures | Estimate |
||
| df | (SE) | p | |
| Time | |||
| Baseline vs. Follow-Up 1 vs. Follow-Up 2 vs. Follow-Up 3 | 3 | – | .53 |
| Baseline vs. Follow-Up 1 | 1 | -.28 (.21) | .19 |
| Baseline vs. Follow-Up 2 | 1 | -.25 (.21) | .24 |
| Baseline vs. Follow-Up 3 | 1 | -.28 (.22) | .21 |
| Condition (Intervention vs. Control) | 1 | -.10 (.16) | .53 |
| Time × Condition | |||
| Baseline vs. Follow-Up 1 vs. Follow-Up 2 vs. Follow-Up 3: Intervention vs. Control | 3 | – | .16 |
| Baseline vs. Follow-Up 1: Intervention vs. Control | 1 | .27 (.41) | .51 |
| Baseline vs. Follow-Up 2: Intervention vs. Control | 1 | .71 (.42) | .09 |
| Baseline vs. Follow-Up 3: Intervention vs. Control | 1 | -.14 (.42) | .71 |

