
Fig. 7.
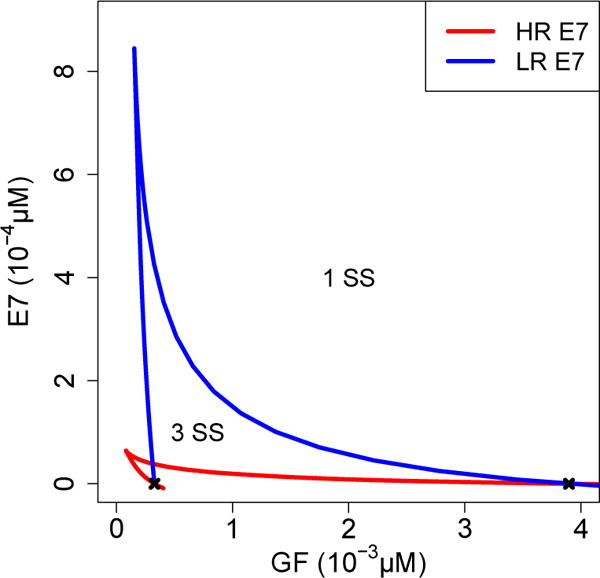
Two parameter diagram illustrating cusp. There are three steady states (SS) of E2F within the region bounded by the two branches of the cusp, and only one steady state of E2F outside this region. The black x marks indicate the two limit points from Figure 4. GF=growth factor HR=high-risk. LR=low-risk