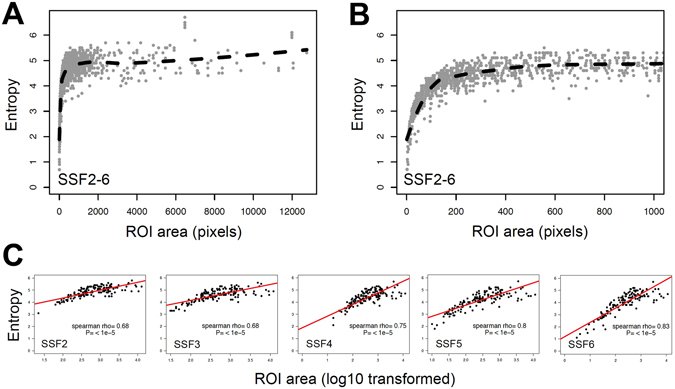
Figure 3.

Entropy is a logarithmic function of the area of the region of interest. (A,B and C) are graphs showing the entropy across all SSFs (A: ROI area from 0 to 12,000 pixels, B: zoom on ROI area smaller than 1,000 pixels) and for all SSF independently (C) in function of the area of the ROI in pixels within synchronous metastases #1. We observed that in every type of tissue (metastasis, normal psoas muscle, and blood in the aorta), entropy is a logarithmic function of the area of the ROI (P < 0.01, R2 = 0.47) rather than a linear one (P < 0.01, R2 = 0.14).
