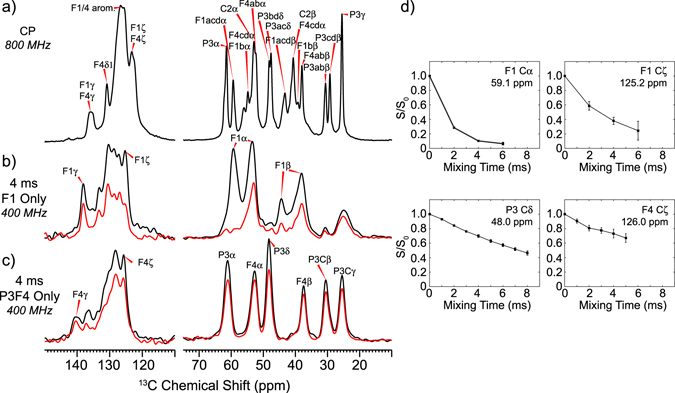
Figure 5.

13C-19F distances are measured using 19F-dephased and 13C-detected REDOR spectra of the PFA-tagged π-clamp peptides. Representative spectra were shown. (a) 13C CP-MAS spectra of the fully labeled peptide 6, showing the aliphatic (right) and aromatic (left) region. Full intensity (S0, black) and dephased (S, red) REDOR spectra at a REDOR mixing time of 4 ms for the F1-only labeled π-clamp peptide 7 (b) and P3F4-only labeled peptide 8 (c) are shown. (d) Experimental S/S0 dephasing values for four representative 13C resonances.
