Figure 2.

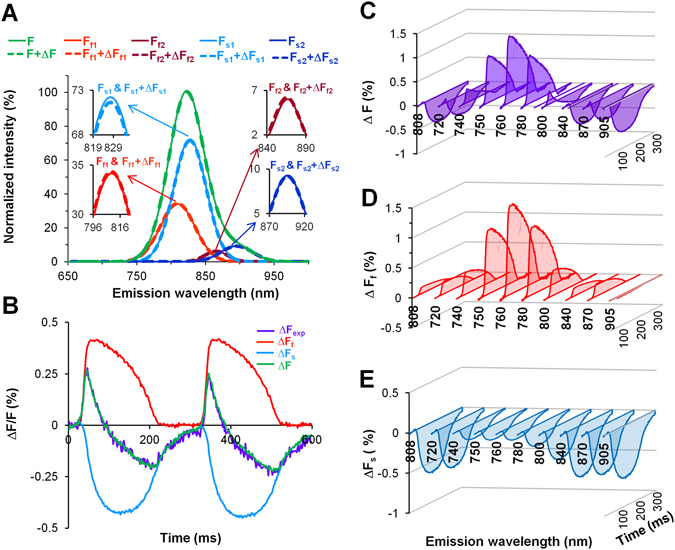
Detection of the emission spectra of the fast and slow components of ICG dye (1 µM) in the heart. (A) Superimposition of spectra recorded at λex = 660 nm; total fluorescence was normalized to 100%. Four separate spectra obtained at rest (solid) and at the maximum amplitude of the AP (dash): two for the fast component (Ff1 and Ff2; red and dark red) and two for the slow component (Fs1 and Fs2; blue and dark blue) are presented alongside the calculated total OS (F and F + ΔF, green). The spectrum peaks on an expanded fluorescence scale are shown in the insets. (B) Superimposition of fractional fluorescence signals at λex/em = 660/800 nm. Experimentally detected with a fast EMCCD camera the total voltage-sensitive OS (ΔFexp; violet), from the total OS calculated fast (ΔFf; red) and slow (ΔFs; blue) components, and recalculated OS (ΔF, the sum of ΔFf and ΔFs; green). (C–E) The ICG fluorescence obtained at λex = 660 and λem from 720 nm to 905 nm for the total fractional fluorescence of OS (ΔF; violet) and for both components: ΔFf (red) and ΔFs (blue). The data shown in all panels were obtained in a single experiment.
