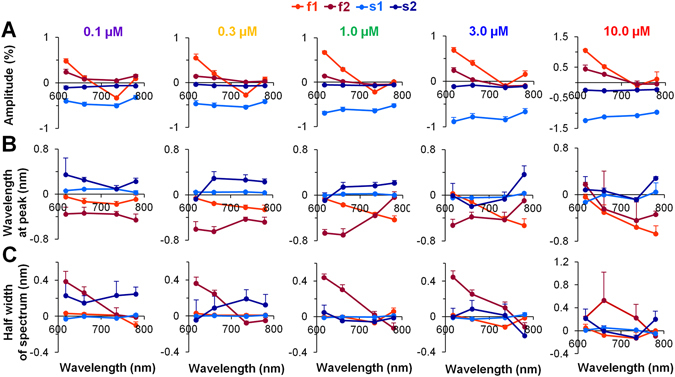
Figure 5.

Mean changes in the Gaussian parameters induced by depolarization for each of the four constituents at various concentrations of the ICG dye. The parameters of the fluorescence signals recorded during excitation at wavelengths of 617 nm, 660 nm, 735 nm, and 780 nm are presented as points. (A–C) Each of the four Gaussian constituents (two for the OSf component (f1 and f2; red and dark red, respectively) and two for the OSs component (s1 and s2; blue and dark blue, respectively) has three parameters: the amplitude, the wavelength at fluorescence maximum (i.e., at the peak of the spectrum), and the half width of the spectrum at 50% of the fluorescence maximum. Note: these parameters were determined at five different concentrations of the ICG dye ranging from 0.1 to 10.0 µM (n = 3–9 for each). Error bars indicate s.e.m.
