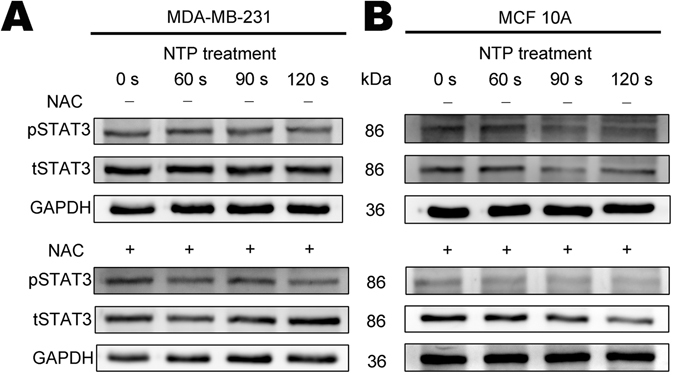
Figure 3.

Effects of NTP on the expression of pSTAT3 and tSTAT3 in MDA-MB-231 and MCF10A cells. All cells were exposed to NTP for 0, 60, 90 or 120 s. After forty-eight hours post-treated with 5 mM N-acetyl cysteine (NAC+) or without (NAC−), proteins from total cell lysates were harvested. The expressions of pSTAT3 and STAT3 in MDA-MB-231 (A) and MCF10A (B) cells were detected by Western blot analysis. GAPDH was taken as a loading control throughout. The gels/blots were processed under the same experimental condition. Cropped gels/blots are displayed and full-length blots/gels are presented in Supplementary Figure 1.
