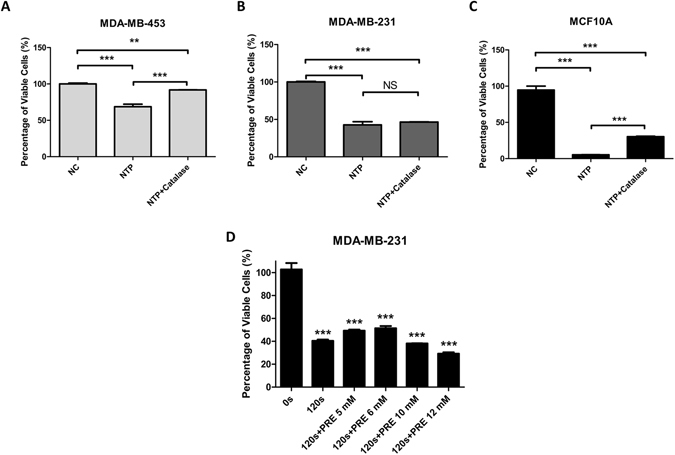
Figure 4.

Effects of 120 s NTP treatments with extracellular and intracellular ROS inhibitor on cells’ proliferation. MDA-MB-453 (A), MDA-MB-231 (B) and MCF10A (C) cells were treated: Negative Control (NC), 120 s NTP treatment (NTP) without or with 500 U/ml catalase (NTP + Catalase). MDA-MB-231 cells (D) were treated: exposed to NTP for 0 and 120 s, pretreat with 5, 6, 10 and 12 mM NAC before 120 s NTP treatment. After forty-eight hours, cell numbers of each dish were counted by an automatic analyzer CountStar. All experiments were replicated a minimum of three times. Data are presented as means ± S.D. and statistical analysis was carried out using one-way ANOVA with Tukey’s multiple comparison test (NS = No significance, *p < 0.05, **p < 0.01, ***p < 0.001).
