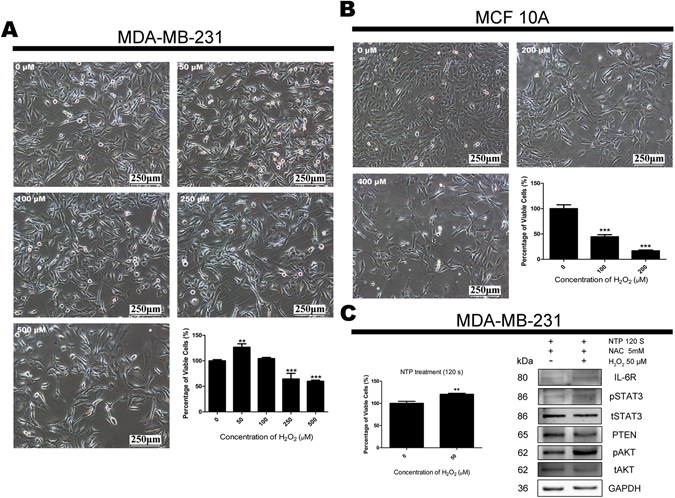
Figure 5.

Effects of H2O2 on the proliferation of MDA-MB-231 and MCF10A cells. MCF10A (A) and MDA-MB-231 (B) cells were incubated with multi-dose H2O2. Forty-eight hours later, cell images were captured with 100 × magnification and cell numbers of each dish were counted by an automatic analyzer CountStar. All experiments were replicated a minimum of three times. Data are presented as means ± S.D. and statistical analysis was carried out using one-way ANOVA with Tukey’s multiple comparison test. MDA-MB-231 cells were post-treated with 5 mM NAC and 0/50 μM H2O2 immediately after 120 s NTP treatment (C). Cell numbers of each dish were counted by an automatic analyzer CountStar and proteins from total cell lysates were harvested after forty-eight hours. Data are presented as means ± S.D. for three independent experiments and analyzed by Student’s t-test. *p < 0.05, **p < 0.01, ***p < 0.001 versus control. The expressions of IL-6R, pSTAT3, tSTAT3, PTEN, pAkt and tAkt were detected by Western blot analysis. GAPDH was taken as a loading control throughout. The gels/blots were processed under the same experimental condition. Cropped gels/blots are displayed and full-length blots/gels are presented in Supplementary Figure 4.
