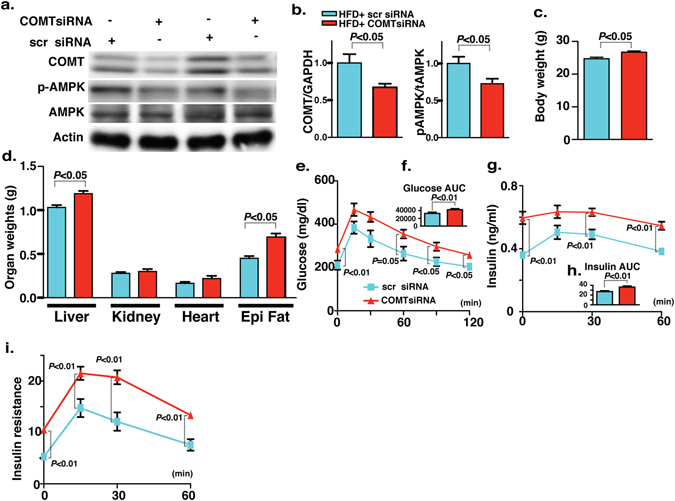
Figure 5.

COMT siRNA-mediated silencing introduces the features of type 2 diabetes and metabolic syndrome in HFD mice. (a,b) Western blot analysis of COMT and AMPK phosphorylation in the liver of scramble and COMT siRNA-injected mice. Scramble and COMT siRNA were injected intraperitoneally once weekly for 3 weeks at a dose of 10 mg/kg body weight. A representative image from 6 blots is shown. Cropped images were displayed and original blots are shown in the figure Supplementary 13. Densitometric data analysis is normalized to Actin. N = 6 were analyzed in each data set. (c,d) Body weight and organ weight measurements in the scramble and COMT siRNA injected mice. N = 6 were analyzed. (e) IPGTT analysis. N = 6 were analyzed in each data set. (f) glucose AUC value. (g,h) Insulin value at different time intervals (0, 15, 30 and 60 min post glucose load) with AUC. N = 6 were analyzed in each data set. (i) Insulin resistance index. N = 6 were analyzed in each data set. Data in the graph are shown as the mean ± s.e.m. Scramble siRNA was designated as scr siRNA whereas COMT siRNA was designated as COMTsiRNA in the figure. Prism7.0 software was utilized for the statistical calculation. The Mann-Whitney test was carried out to determine of statistical significance.
