
Figure 6.
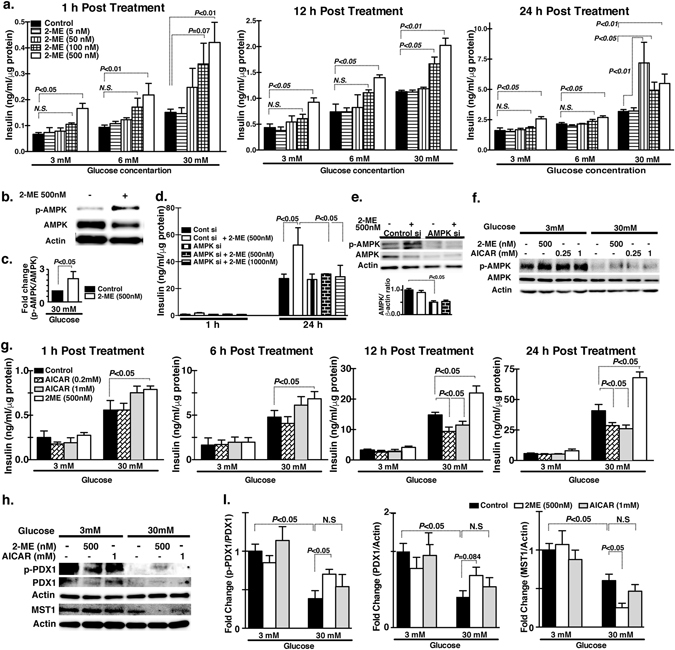
2-ME induced insulin secretion in MIN6 cells. (a) Time-dependent insulin secretion by 2-ME (5, 50, 100 and 500 nM concentrations) at 3 mM, 6 mM and 30 mM medium glucose concentrations. Insulin estimation by the ELISA method performed in triplicate. Three sets of independent experiments were performed. (b,c) Western blot data analysis of control and 2-ME-treated MIN6 cells. A representative image of 5 blots is shown. Cropped images were displayed and original blots are shown in the figure Supplementary 14. Densitometry data were normalized to β-actin. (d) Time-dependent insulin secretion by 2-ME in the scramble and AMPK siRNA transfected MIN6 cells. Scramble and AMPK siRNA were transfected using lipofectamine 2000 at 100 nM concentration in cells. Insulin estimation was performed in triplicate. Three sets of independent experiments were analyzed. (e) Western blot analysis of total AMPK and AMPK phosphorylation protein levels in the scramble and AMPK siRNA transfected MIN6 cells. A representative image from 5 blots is shown. Cropped images were displayed and original blots are shown in the figure Supplementary 14. Densitometry data normalized to β-actin. (f) Western blot analysis of total AMPK and AMPK phosphorylation after treatment with 2-ME and AICAR at 3 mM glucose and 30 mM glucose concentration. A representative image from 4 blots is shown. Cropped images were displayed and original blots are shown in the figure Supplementary 15. (g) Time-dependent insulin level in 2-ME and AICAR-treated cells in the 3 mM glucose and 30 mM glucose media concentration. Insulin estimation assays were performed in triplicate. (h,i) Western blot analysis of PDX1, PDX1 phosphorylation and MST1 in 2-ME and AICAR-treated cells under 3 mM and 30 mM of glucose concentration for 24 hours. A representative image of 4 blots is shown. Cropped images were displayed and original blots are shown in the figure Supplementary 16. Densitometry data were normalized to Actin. N = 4 were analyzed in each data set. The data in the graph are shown as the mean ± s.e.m. Prism3 software was utilized for the statistical calculation. The One way Anova (Tukey test) was carried out to determine of statistical significance.