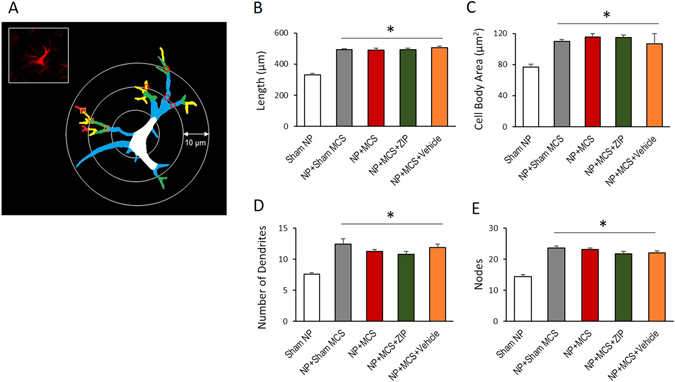
Figure 8.

Neuropathic pain and MCS induce astrocytic hypertrophy. (A) Schematic of astrocytes and the parameters measured. Astrocytes were identified using a GFAP antibody, and images were then analyzed. The colors on the images indicate different morphological features: White = cell body, Blue = first-order branch, Green = second-order branch, Yellow = third-order branch, and Red = fourth-order branch; Red square = branch point; and Red circle = intersections. (B) The total length of the astrocytic processes from the ACC regions. The total length of the astrocytic processes in different groups was significantly increased compared with the sham NP group. (C) The cell body areas of astrocytes in the ACC. The cell body areas of the astrocytes in different groups were increased significantly compared with the sham NP group. (D) The number of dendrites in different groups. There were significant increases in the number of primary (first-order) processes in experimental groups compared with the sham NP group. (E) The number of nodes in different groups. The numbers of nodes (second to fourth-order branch) in the experimental groups were significantly increased compared with the sham NP groups. Taken together, peripheral neuropathy induced astrocytic hypertrophy; however, MCS or ZIP did not interfere with this response. *P < 0.05 compared with sham NP.
