
Figure 3.
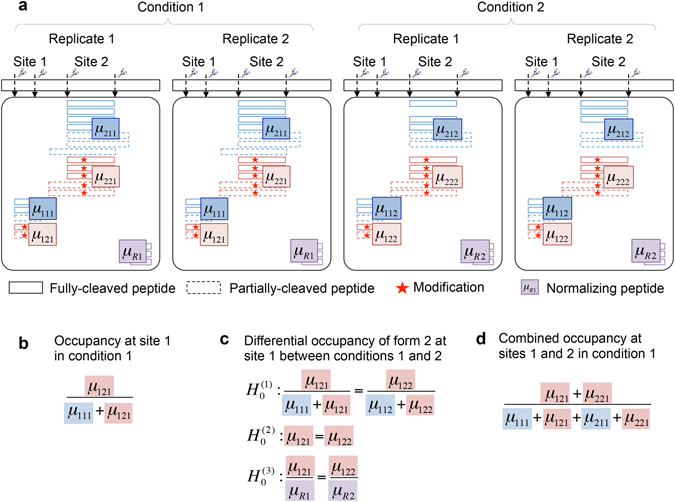
Goals of statistical characterization of therapeutic proteins. (a) Schematic representation of the data, in a simplified case of two conditions, two replicate runs, two sites and two forms. A form in each site is quantified by multiple spectral features (boxes), which are charge states and isotopes of a peptide. The feature intensities are viewed as repeated measurements of the underlying abundance of the form, where the abundance of site i, form j, and condition k is denoted by μijk. Peptides can be fully cleaved (solid lines) and/or partially cleaved (a.k.a., mis-cleaved, dashed lines). Some spectral features can be missing. (b) Goal 1: statistical characterization of site occupancy estimates the quantities underlying a peptide feature in each condition, replicate, site and form. (c) Goal 2: statistical characterization of differential site occupancy tests the null hypothesis of no change against the alternative. The hypotheses differ in the use of the normalizing factor in the denominator. (d) Goal 3: as in (b), but combining the quantitative information across multiple sites.