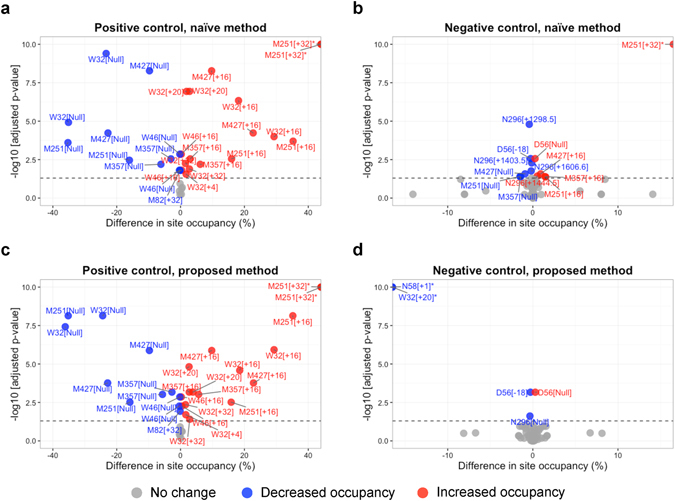
Figure 6.

Goal 2: differential site occupancy. Volcano plots for the tests of differential site occupancy based on H 0 (1). Each dot represents the testing result for differential site occupancy of one form. X-axis: practical significance, difference in site occupancy between conditions. Y-axis: statistical significance, FDR-adjusted p-values on the negative log10 scale. The horizontal dashed lines represent the 0.05 FDR cutoff. Forms with decreased and increased site occupancies are shown in blue and red colors, respectively. (a) Comparison of sites in Fab and Fc between AI 3 mM AAPH or AI 10 mM AAPH versus AI reference by the naïve method. All forms are expected to change in the comparison (positive control). (b) Comparison between ADC reference versus AI reference by the naïve method, excluding the sites for drug modifications. None of the forms is expected to change in the comparison (negative control). (c) As in (a), but by the proposed method. (d) As in (b), but by the proposed method.
