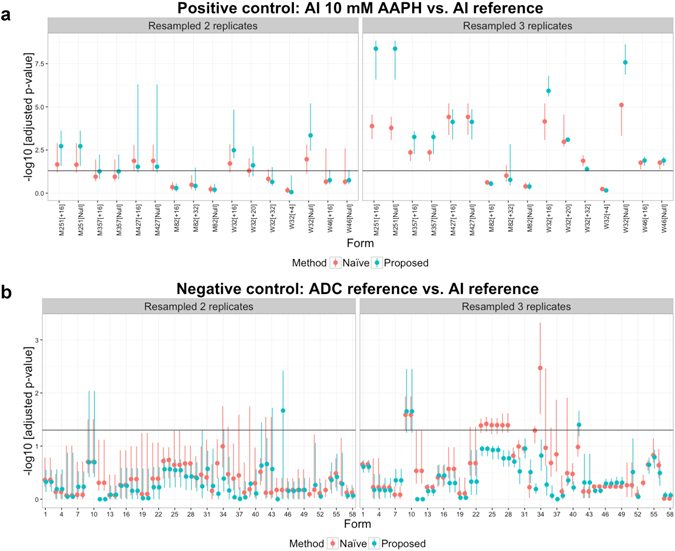
Figure 7.

Differential analysis with small sample sizes. The replicate LC-MS/MS runs of the AI 10 mM AAPH, AI reference and ADC reference samples were resampled to a size of 2 or 3 per condition (without replacement) prior to the differential analysis based on H 0 (1). X-axis: compared forms. Y-axis: statistical significance, FDR-adjusted p-values on the negative log10 scale. The horizontal lines indicate the 0.05 FDR cutoff. For each form, the vertical line represents the range between the maximum and minimum significance values among the testing results for the resampled data, and the dot represents the medium value. (a) The results for the positive controls (AI 10 mM AAPH versus AI reference). (b) The results for the negative controls (ADC reference versus AI reference). The list of compared forms for the negative controls is shown in Supplementary Table S6.
