
Figure 1.
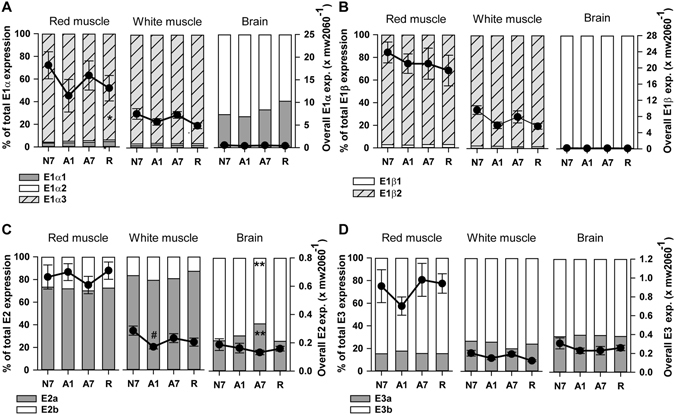
mRNA transcript levels of PDHc subunits (A) E1α, (B) E1β, (C) E2 and (D) E3 in red muscle, white muscle and brain of crucian carp. X axes show treatment groups: normoxic control (N7), 1 day anoxia (A1), 7 days anoxia (A7) and reoxygenation (R). Left y-axes and bars show percentage distribution of paralogs, while right y-axes and filled circles show overall expression levels of genes (means ± S.E.M. of all paralogs combined; n = 6–8 fish per group). Significant difference compared to N7 is indicated by * for percentage distribution data and # for overall expression. */#P > 0.05; **/##P > 0.01; ***/###P > 0.001 (One-way ANOVA; Holm-Sidak post-hoc test).