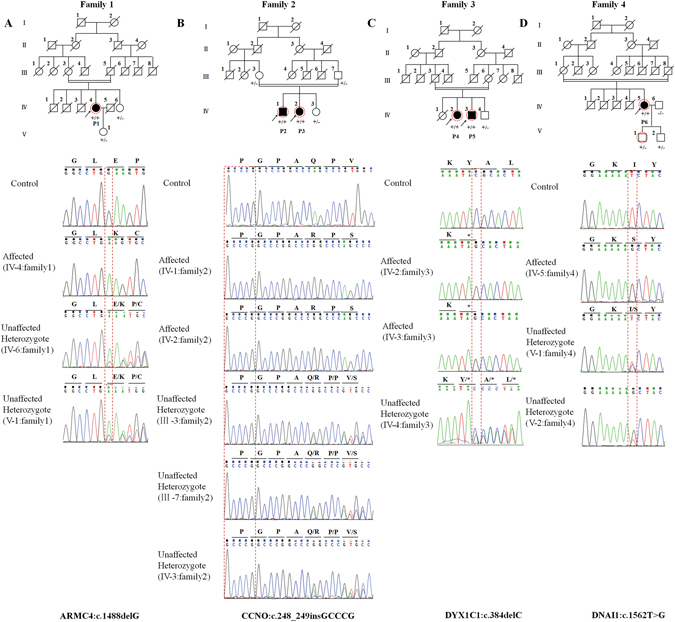
Figure 2.

Pedigree of the families and the Sanger DNA sequencing chromatogram of the patients. Roman numerals refer to generations, and individuals within a generation are numbered from left to right. Black circles/squares are affected, and white circles/squares are unaffected. Arrows indicate the probands. P1-P6 are the probands (P1 refers to IV-4 in family 1; P2 and P3 refer to IV-1 and IV-2 in family 2, respectively; P4 and P5 refer to IV-2 and IV-3 in family 3, respectively; and P6 refers to IV-5 in family 4). Seven large circles (in red) represent the 7 individuals who underwent WES. The Sanger sequencing chromatogram of the affected patient, unaffected carrier, and control is shown under each pedigree. The genotype is indicated in the pedigree charts:+/+, affected patient (homozygous mutation);+/−, unaffected carrier (heterozygous mutation); and −/−, unaffected control.
