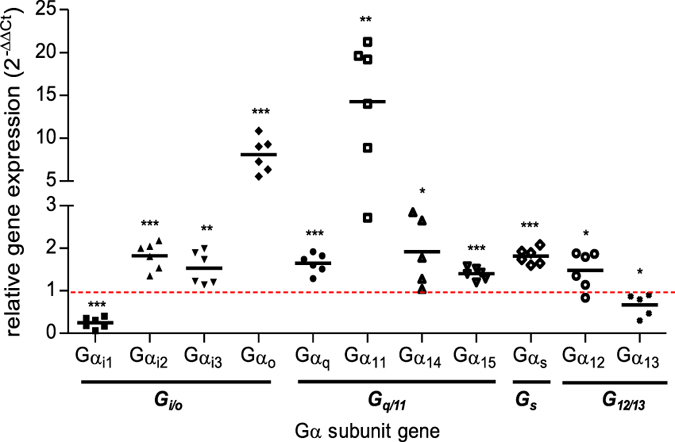
Figure 1.

Quantification of heterotrimeric G protein α subunits gene expression levels in hypertrophic cardiomyocytes. Comparative analysis of Gα subunit gene expression of the four G protein families (Gi/o, Gq/11, Gs, G12/13) in total RNA extracts from cardiomyocytes isolated from mice exhibiting or not (control) transversal aortic banding (TAC) obtained by Fluidigm Real-time qPCR. Results are expressed as the relative induction of the genes in C57Bl/6 mice submitted to TAC for 15 days (n = 6) compared to control mice (n = 6) wherein genes expression are equal to 1. The statistical significance of the change in expression level was assessed using unpaired Student’s t-test. *P < 0.05, **P < 0.01, ***P < 0.001.
