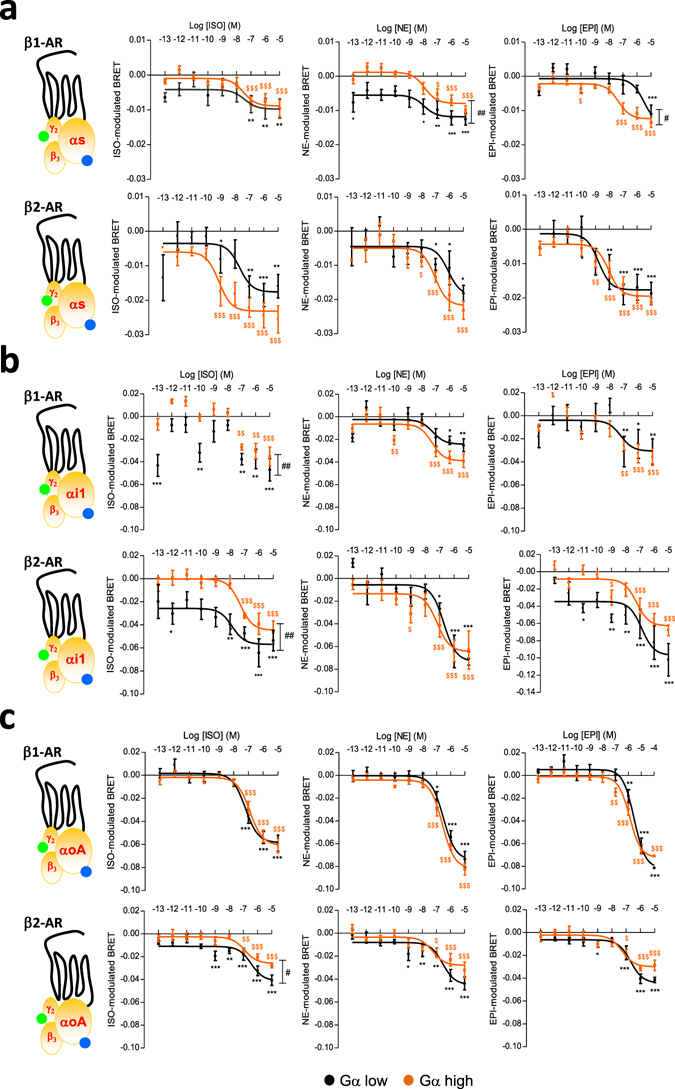
Figure 3.

Influence of the Gα subunit expression level on the concentration-response curves of β-AR agonists-mediated G protein activation. (a–c) BRET in HEK293T cells co-expressing HA-β1-AR (upper panels) or HA-β2-AR (lower panels) receptors and low (black) or high (orange) expression levels of Gαs-Rluc8 (a), Gαi1-Rluc8 (b) or GαoA-Rluc8 (c) in presence of fixed GFP10-Gγ2 and Gβ3 untagged subunits. Cells were stimulated or not for 1 min with increasing concentrations of the indicated agonists (Isoproterenol, ISO; Norepinephrine, NE; Epinephrine, EPI). Results are expressed as the difference in BRET signals measured in presence and absence of ligand. Data represent the mean ± s.e.m. of at least four independent experiments. The statistical significance between unstimulated cells and cells stimulated with the different ligand concentrations in low (*) and high ($) Gα-Rluc8 conditions was assessed using one-way ANOVA followed by a Dunnett’s multiple comparison test (*P < 0.05, **P < 0.01, ***P < 0.001). The statistical significance between low and high dose-response curves was assessed using two-way ANOVA followed by a Bonferroni post-test (# P < 0.05, ## P < 0.01).
