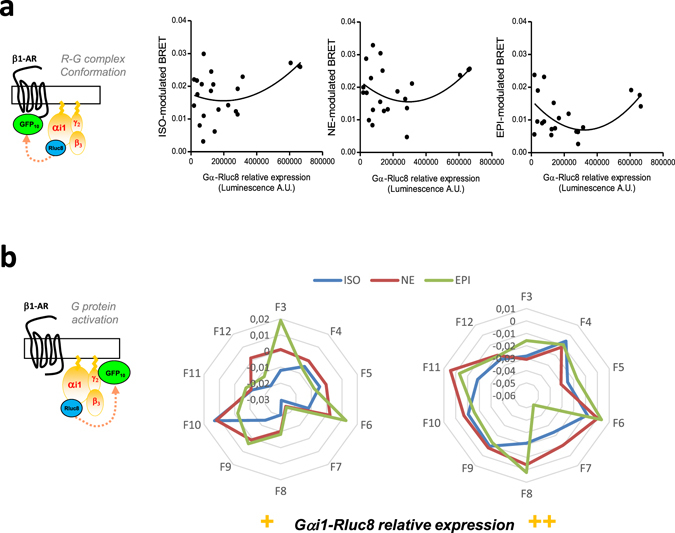
Figure 5.

Influence of the Gα stoichiometry on β-adrenergic agonist responses through different membrane Receptor-G protein populations. (a) Receptor-G protein complexes conformations assessed by BRET in HEK293T cells co-expressing β1AR-GFP10 receptor and different expression levels of Gαi1-Rluc8 in presence of fixed Gγ2 and Gβ3 untagged subunits. Cells were then stimulated or not for 1 min with 10 µM of the indicated ligands (ISO, NE or EPI). Results are expressed as the difference in BRET signals measured in presence and absence of ligand and are representative of four independent experiments. Curves were generated using a polynomial quadratic model. (b) G protein activation measured in sucrose fractions by BRET in HEK293T cells, co-expressing HA-β1AR receptor and different expression levels of Gαi1-Rluc8 in presence of fixed GFP10-Gγ2 and Gβ3 untagged subunits, and processed for raft purification. Results are expressed as the difference in BRET signals measured in presence and absence of ligand and plotted in the wheel diagram from the different sucrose fractions (F3 to F12). They are representative of three independent experiments.
