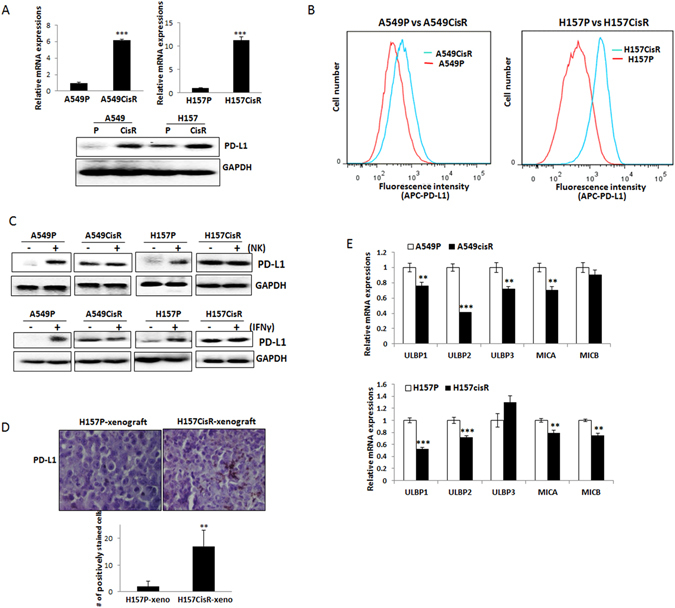
Figure 2.

PD-L1/NKG2D ligand expressions in cisplatin-resistant cells vs. parental cells. (A) qPCR (upper panel) and Western blot (lower panel) analyses detecting expressions of PD-L1 in A549P/A549CisR and H157P/H157CisR cells. (B) Flow cytometric analyses of PD-L1 in A549P/A549CisR and H157P/H157CisR cells. Relative fluorescence stained with APC-conjugated anti-PD-L1 Ab was shown. (C) Western blot analysis of PD-L1 in A549P/A549CisR and H157P/H157CisR cells after co-culture with NK cells. Upper panel shows the PD-L1 levels in A549P/A549CisR and H157P/H157CisR cells after co-culture with NK cells for 4 hours. Lower panel shows the PD-L1 levels in A549P/A549CisR and H157P/H157CisR cells after incubation (4 hours) with recombinant human IFNγ (rhIFNγ). (D) IHC staining of PD-L1 in tumor tissues of H157P and H157CisR-derived xenografts. PD-L1 levels in tumor tissues, derived from H157P cell and H157CisR cell-derived xenografts were examined. Error bars and significance values were obtained by counting positively stained cells in one randomly chosen phase of slides of 3 different stains. Magnification, 20X. (E) qPCR analyses of NKG2D ligands in A549P/A549CisR and H157P/H157CisR cells. **p < 0.01, ***p < 0.001.
