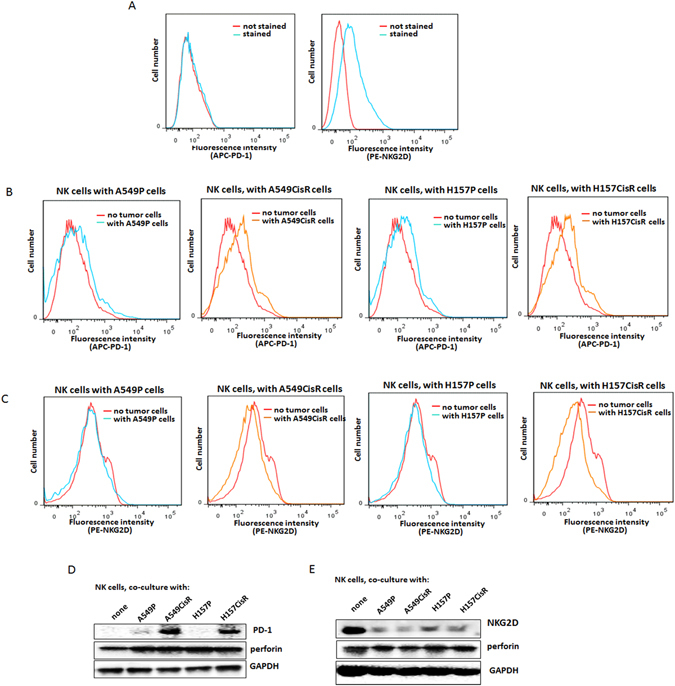
Figure 3.

Expression of PD-1/NKG2D in NK cells, with or without co-culture with tumor cells. (A) Flow cytometric analyses of NKG2D and PD-1 in NK cells. Primary NK cells were stained with PE-NKG2D or APC-PD-1 and positive staining was analyzed. (B) Flow cytometric analyses of PD-1 on NK cells, after co-culture with tumor cells (6 hours of incubation). Primary NK cells were added into tumor cells (1:1 ratio, tumor cells:NK cells) and collected after 6 hours of incubation. PD-1 level in the collected NK cells were analyzed in flow cytometric analysis (using APC-PD-1 Ab). (C) Flow cytometric analyses of NKG2D on NK cells, after co-culture with tumor cells (6 hours of incubation). (D) Western blot analyses detecting PD-1 levels in NK cells after co-culture with tumor cells. NK92 cells were used in these tests. (E) Western blot analyses of NKG2D levels in NK92 cells when co-cultured with tumor cells. **p < 0.01, ***p < 0.001.
