
Figure 3.
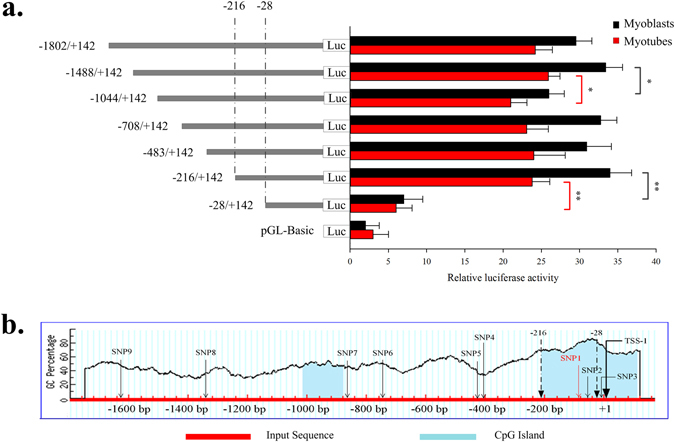
Luciferase activities in the bovine SIX1 promoter constructs in QCMCs. (a) All plasmids containing 5′ unidirectional deletions of the promoter region of the SIX1 gene (pGL3 −1802, −1488, −1044, −708, −483, −216, −28 and pGL3-Basic) were transfected into QCMCs. After 5 h we replaced the transfection mixture with DMEM with 2% HS (myotubes). The cells were collected for the luciferase assay at 48 h. The results are expressed as the mean ± standard deviation in arbitrary units based on firefly luciferase activity normalized to the Renilla luciferase activity in triplicate transfections. The unpaired Student’s t-test was used to detect significant differences. “*”P < 0.05 and “**”P < 0.01. (b) A graphical representation of the bovine SIX1 gene proximal promoter region from +1 to −1802 base pairs, predicting the regions with a high GC content. Folded lines indicate the GC percentage, which is represented on the y-axis, and the x-axis denotes the bp position on the 5′ untranslated region; the bottom of the blue area indicates the relative positions of the CpG islands. Coordinates are given relative to the translational start site (shown as +1). Arrows indicate TSS-1, positions −216 and −28 bp and nine SNP loci in the promoter, of which SNP1 and SNP2 were located in the proximal minimal promoter of the SIX1 gene.