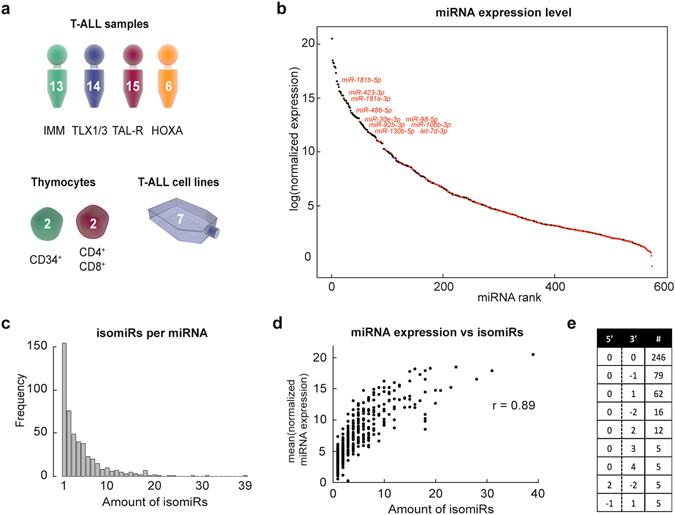
Figure 1.

Small RNA-sequencing of T-ALL samples, healthy thymocytes and cell lines detects novel T-ALL miRNAs and isomiRs. (a) Overview of samples profiled by small RNA-sequencing. (b) Dot plot representing the mean normalized expression levels of all 574 miRNAs detected by small RNA-sequencing of the 48 T-ALL patient samples. Each dot represents one miRNA and the miRNAs are ranked from highest to lowest mean expression. Black dots are miRNAs that were already detected by a qRT-PCR platform from previous studies. Red dots are the novel miRNAs detected in T-ALL samples. (c) Bar plot visualizing the distribution of the miRNAs by means of the amount of isomiRs they are represented by. (d) Correlation plot between the mean expression level of the miRNAs and their amount of isomiR forms. (e) Table representing the isomiR form that was represented by the highest expression level for each of the detected miRNAs. The first column denotes the 5′ overhangs or deletions, the second column the 3′ overhang or deletions of the isomiR in comparison to the canonical miRNA. The third column shows the amount of miRNAs of which the highest expressed miRNA had that isomiR form. (Graphics from www.somersault1824.com).
